Monitoring details page
To display the Monitoring Details page, open Material Management > Material Monitoring and click on Details > in the row of the corresponding material or click on the Monitoring tab after searching for a material in the Material per ID tab.
Click  Back to switch back to the Material Monitoring page. Back to switch back to the Material Monitoring page.
|
Description details
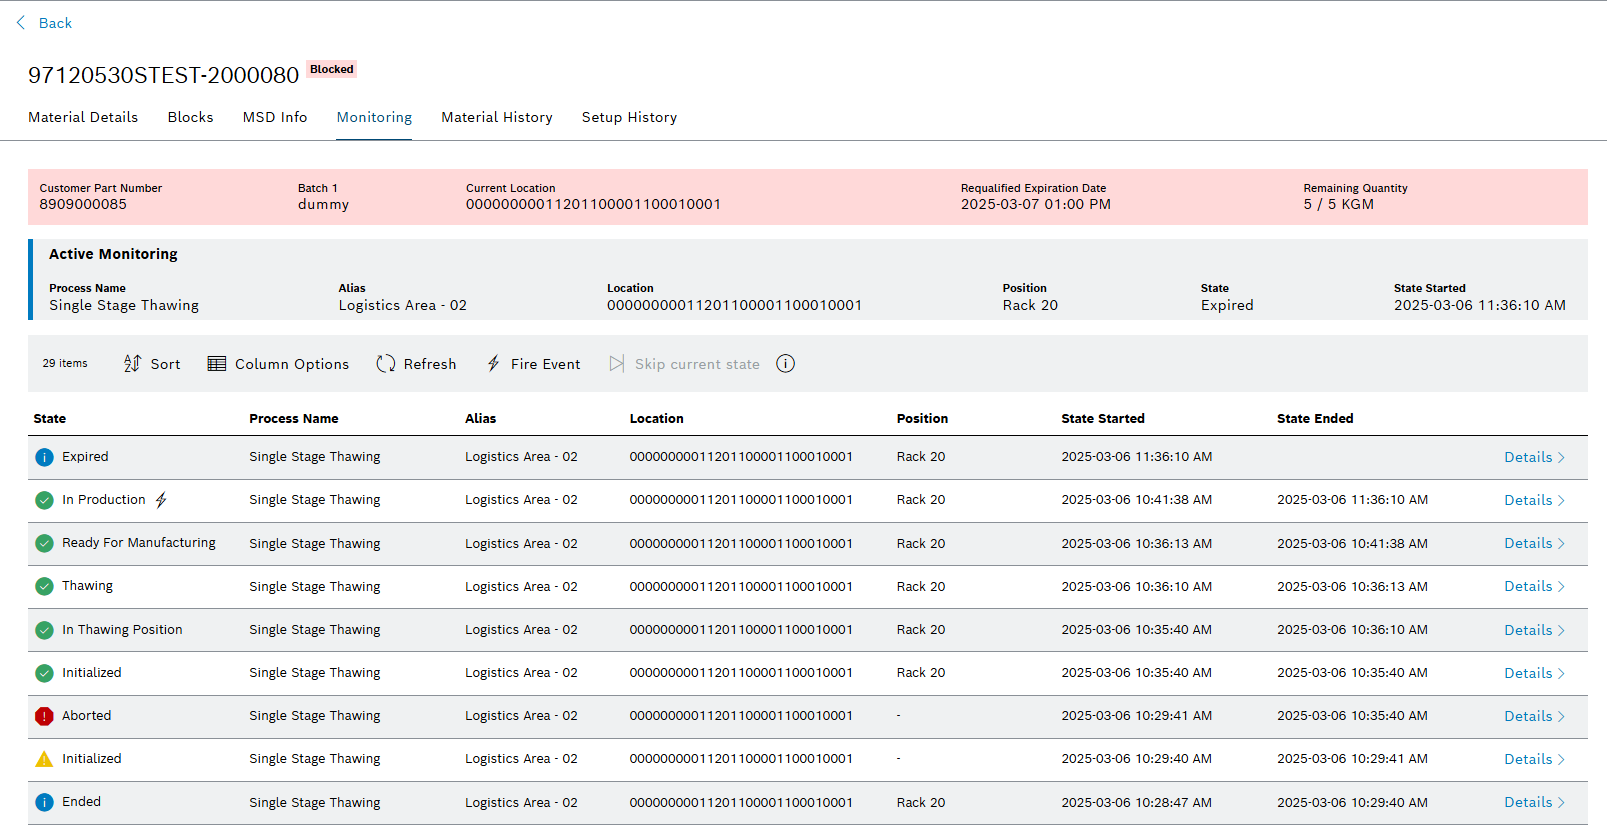
The Monitoring Details page shows information about the active monitoring entry of the monitoring process and a table with the history of all the steps of Material Monitoring for the material. It also allows to manually fire events (transitions to another state) for the current monitoring process, in case a necessary state transition cannot be triggered by scanning a location or is initiated by another system (e.g. Direct Data Link).
Header
| Element | Description |
|---|---|
<nn> Items |
The number of monitoring entries which were found for the current material. |
|
Adjust the sorting of the table of monitoring entries. |
|
Adjust the displayed columns in the table of monitoring entries. |
|
Refreshes the data. |
|
Manually trigger an event (change state) via Fire Events. |
|
Reprint the label (only enabled for processes which can print). |
|
Skip the current state, if available |
|
When hovered, displays information about when skipping is available for this process. |


Monitoring History
| Element | Description |
|---|---|
State |
The state of the monitoring entry. |
Process Name |
The process name of the monitoring entry. |
Location |
The location of the monitoring entry. |
Position |
The position of the monitoring entry. |
State Started |
The time when the monitoring entry started (when the state was entered). |
State Ended |
The time when the monitoring entry ended (when the state was changed to another state). |
Details |
Displays the monitoring entry details. |
State column
| Element | Description |
|---|---|
|
The monitoring process was stopped with state Aborted. |
|
The monitoring process was exited prematurely due to an error. |
|
The monitoring process reached it’s end state. In an end state no further state transitions happen and the process can only be restarted by scanning the material at a location with the starting state again. |
|
The monitoring process is not an end state and was or is executing without errors. |
|
A state transition has been triggered from an external event sent via Fire Event, Skip current state or Reprint. |


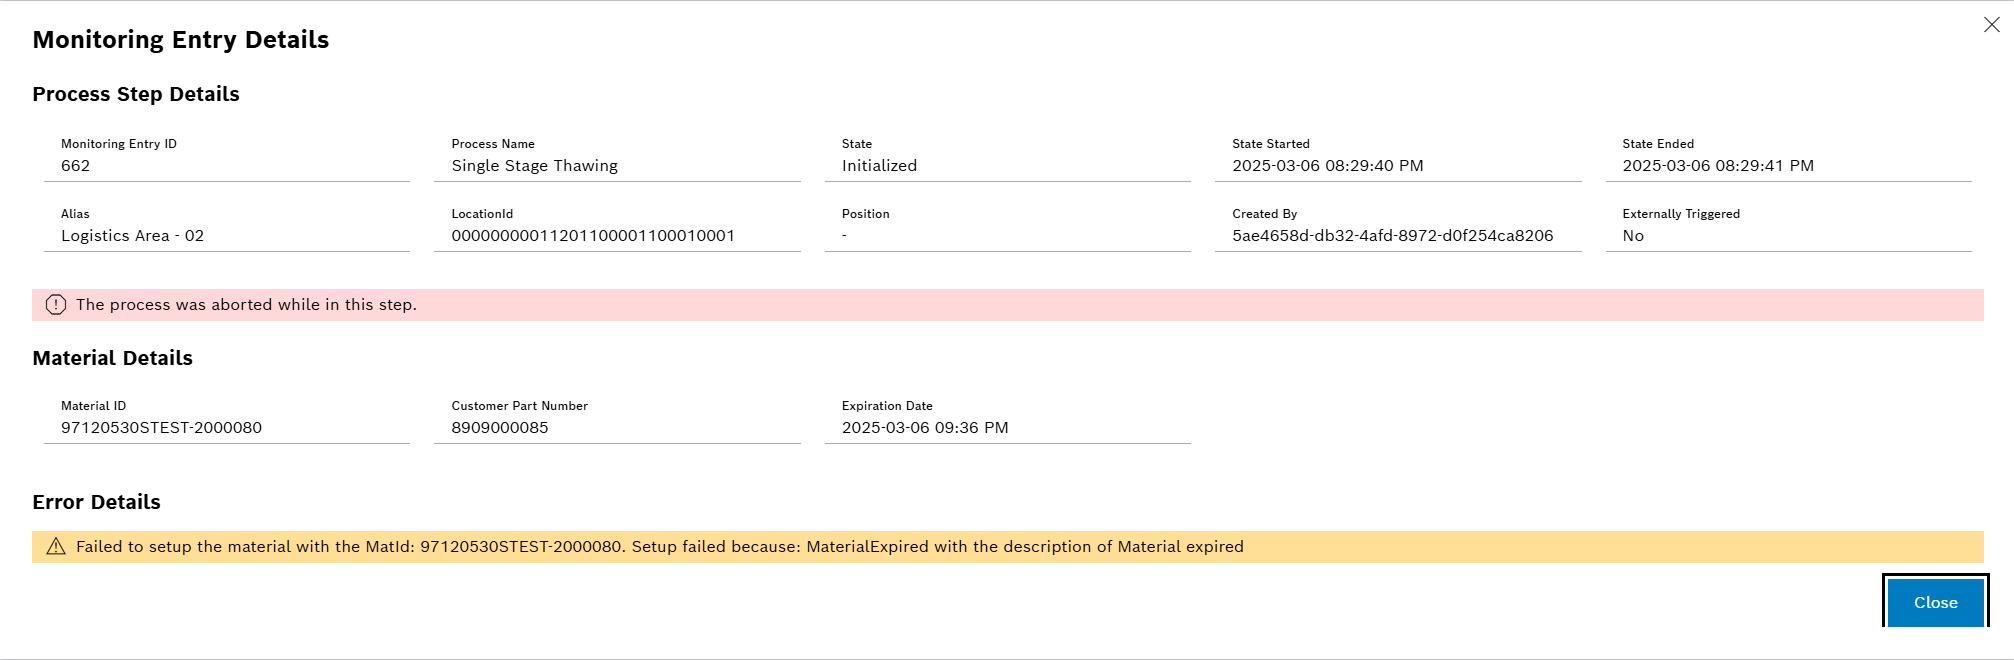
Monitoring entry details
Displays all available data of a specific monitoring entry.
| Element | Description |
|---|---|
Monitoring Entry ID |
The unique identifier of the entry. |
Process Name |
The process name of the entry. |
State |
The state of the entry. |
State Started |
The time when the monitoring entry started (when the state was entered). |
State Ended |
The time when the monitoring entry ended (when the state was changed to another state). |
LocationId |
The position of the entry. This is the position where the material was scanned / moved to, or the position of the previous entry if no new location and position information was available. |
Position |
Position of the material in the location. |
Created by |
Identifies the user who started the monitoring process or triggered the event for the current state. |
Externally Triggered |
Shows Yes if the state for this entry was caused by an external event trigger (Fire Event) or No if it was an automatic / time-based state transition. |
Error Banner |
Shows a banner if the current step ended prematurely due to the process and material being disposed or if an error happened in this step. |
Material Details |
Shows the details for the scanned material. |
Material ID |
The Identifier of the monitored material. |
Customer part Number |
The Customer Part Number of the monitored material. |
Expiration Date |
The Expiration Date of the monitored material. |
Error Details |
Shows the error message if an error happened in this step. |