Nexeed

Process Quality

    • Introduction
    • User manual
      • Basic operation
        • Create and delete a device as a favorite
        • Use a filter
      • Process
        • Compare Processes
        • Change Axes in the Diagram
        • Show and Hide Axis in the Diagram
        • Show special values
        • Display Measured Values in the Diagram
        • Display process data in the diagram
        • Displaying diagram content
        • Permanently highlight the process curve
        • Temporarily highlight the process curve
        • Monitoring processes
        • Configure columns
        • Export process data
    • API documentation
Process Quality
  • Industrial Application System
  • Core Services
    • Block Management
    • Deviation Processor
    • ID Builder
    • Multitenant Access Control
    • Notification Service
    • Reporting Management
    • Ticket Management
    • Web Portal
  • Shopfloor Management
    • Andon Live
    • Global Production Overview
    • KPI Reporting
    • Operational Routines
    • Shift Book
    • Shopfloor Management Administration
  • Product & Quality
    • Product Setup Management
    • Part Traceability
    • Process Quality
    • Setup Specs
  • Execution
    • Line Control
    • Material Management
    • Order Management
    • Packaging Control
    • Rework Control
  • Intralogistics
    • AGV Control Center
    • Stock Management
    • Transport Management
  • Machine & Equipment
    • Condition Monitoring
    • Device Portal
    • Maintenance Management
    • Tool Management
  • Enterprise & Shopfloor Integration
    • Archiving Bridge
    • Data Publisher
    • Direct Data Link
    • Engineering UI
    • ERP Connectivity
    • Gateway
    • Information Router
    • Master Data Management
    • Orchestrator
Nexeed Learning Portal
  • Process Quality
  • User manual
  • Process
  • Permanently highlight the process curve
✎

Permanently highlight the process curve

To maintain an overview of several processes, a process curve can be permanently highlighted. With permanent highlighting, the corresponding process curve is displayed prominently in the diagram.

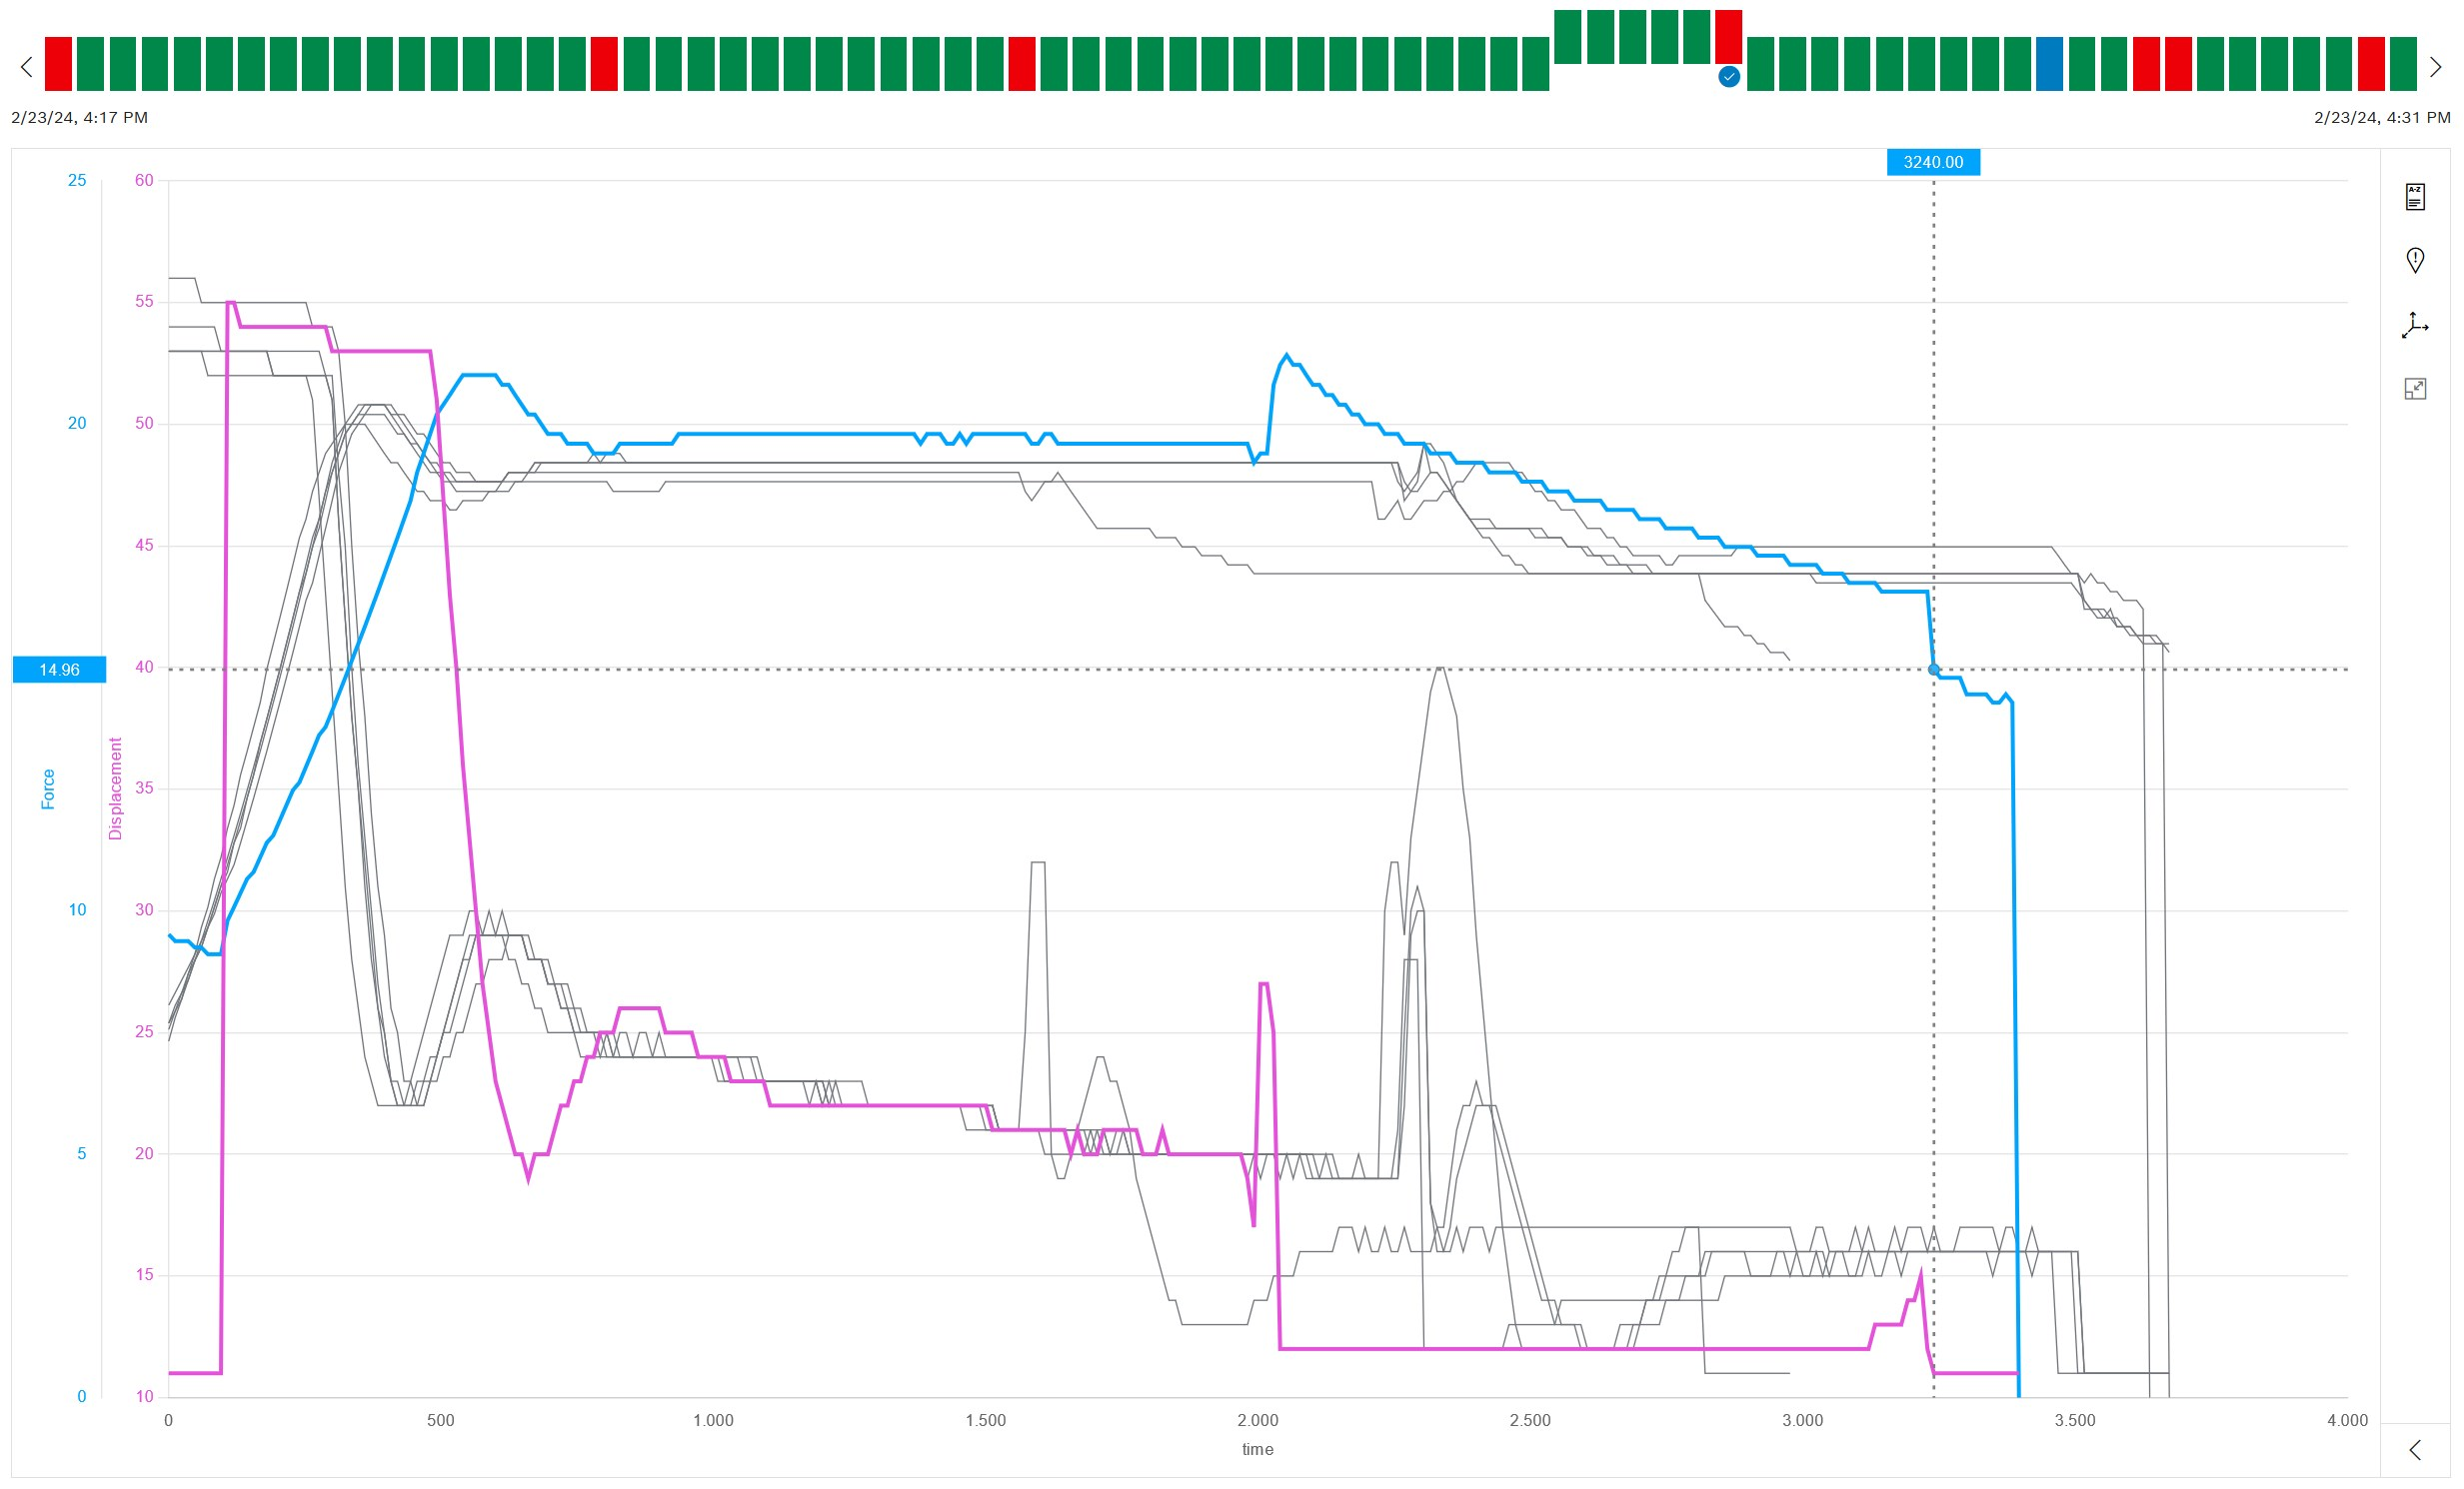
In comparison mode, the permanently highlighted process curve is marked in the status bar.

Prerequisites

  • Process Quality User or Process Quality Expert role

  • At least two measuring points are defined for the selected device type.

Two measuring points are required for the diagram view, however. Measuring points are defined in the Master Data Management module.

Procedure

  1. Open the Process Quality menu.

  2. In the overview, click the desired device tile:
    Select device for analysis

  3. To filter the processes in the status bar, click filter in the header:
    Use a filter

  4. Select process for analysis.

  5. Permanently highlight the process:

    • Option 1 (comparison mode inactive):

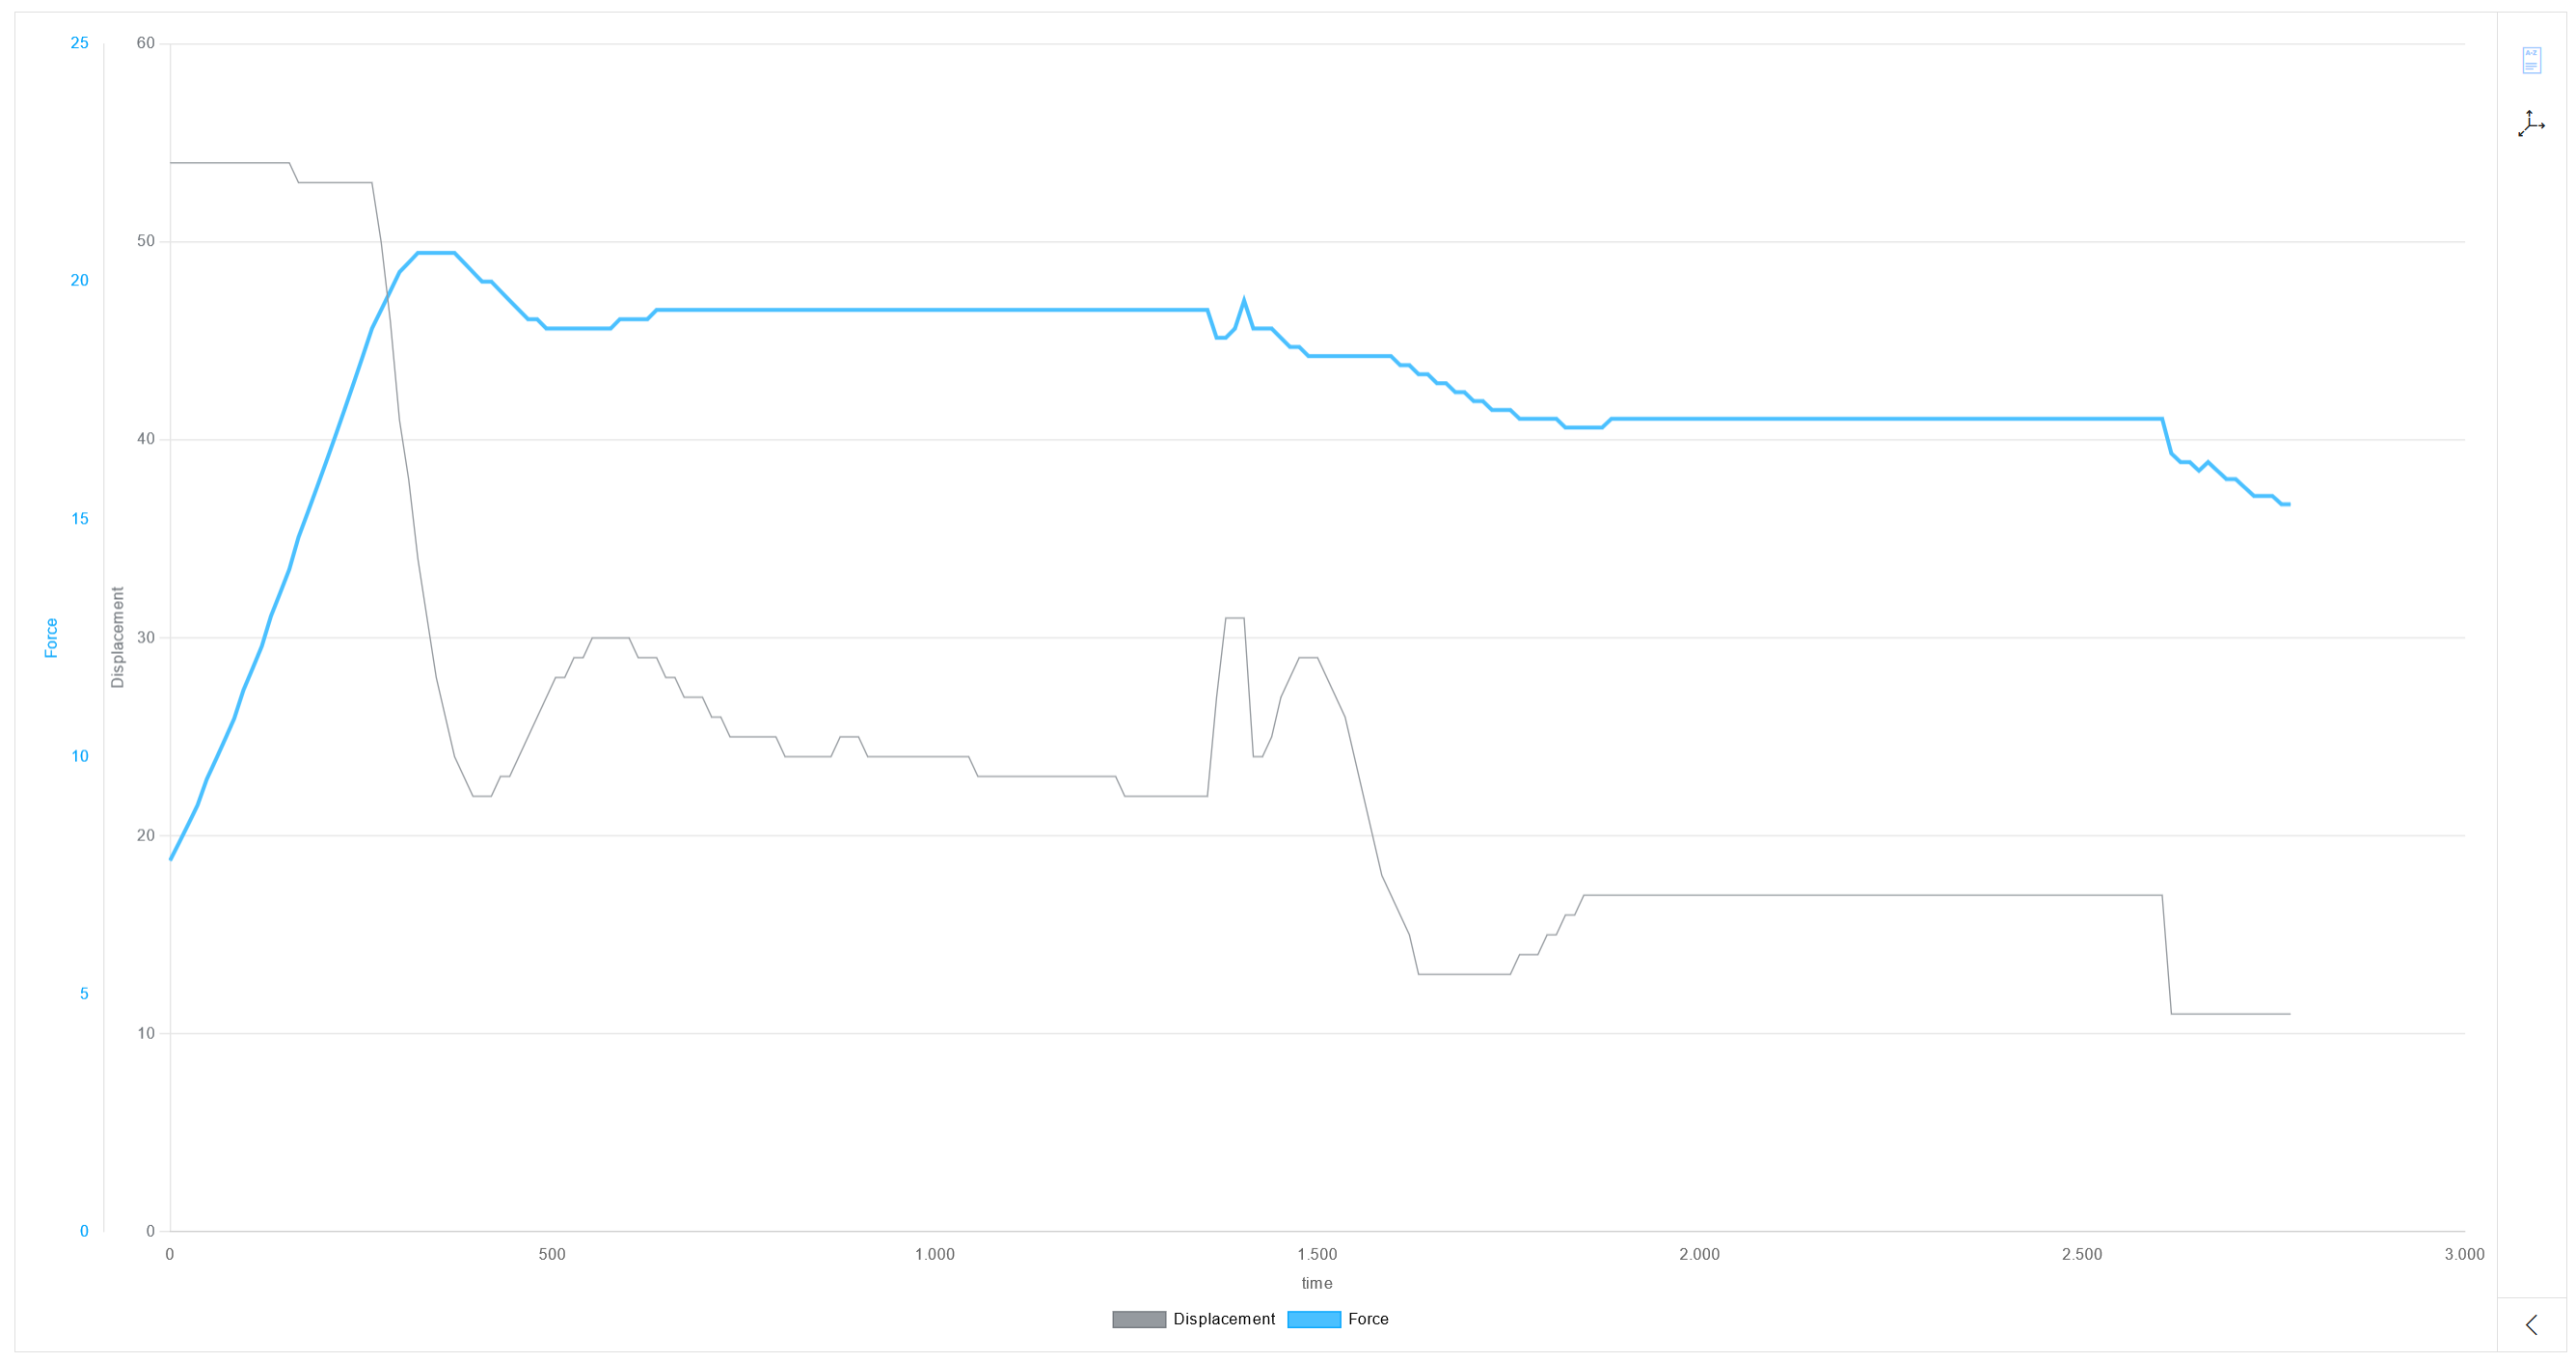
      Click the desired process curve in the diagram.

    • Option 2 (comparison mode active):

      Click on the desired process curve in the diagram or on checkmark-frame_grey in the status bar under the desired process.

The process curve is highlighted permanently. All other diagram elements change to gray.

pqm_chart_highlighting

If the comparison mode is active ( Compare processes ), all process curves of the selected process are highlighted. The color of the legend and the Y-axis do not change.
The process to which the highlighted process curves in the status bar belong is indicated by alert-success-filled_blue.
status_bar_highlighting_clicked_comparemode

pqm_chart_compare_linking_clicked

The highlighting is retained when you switch between the views.

Contents

© Robert Bosch Manufacturing Solutions GmbH 2023-2025, all rights reserved

Changelog Corporate information Legal notice Data protection notice Third party licenses