Compare processes
To identify deviations and differences in parameters, multiple processes of a device can be compared. The following evaluations are possible:
-
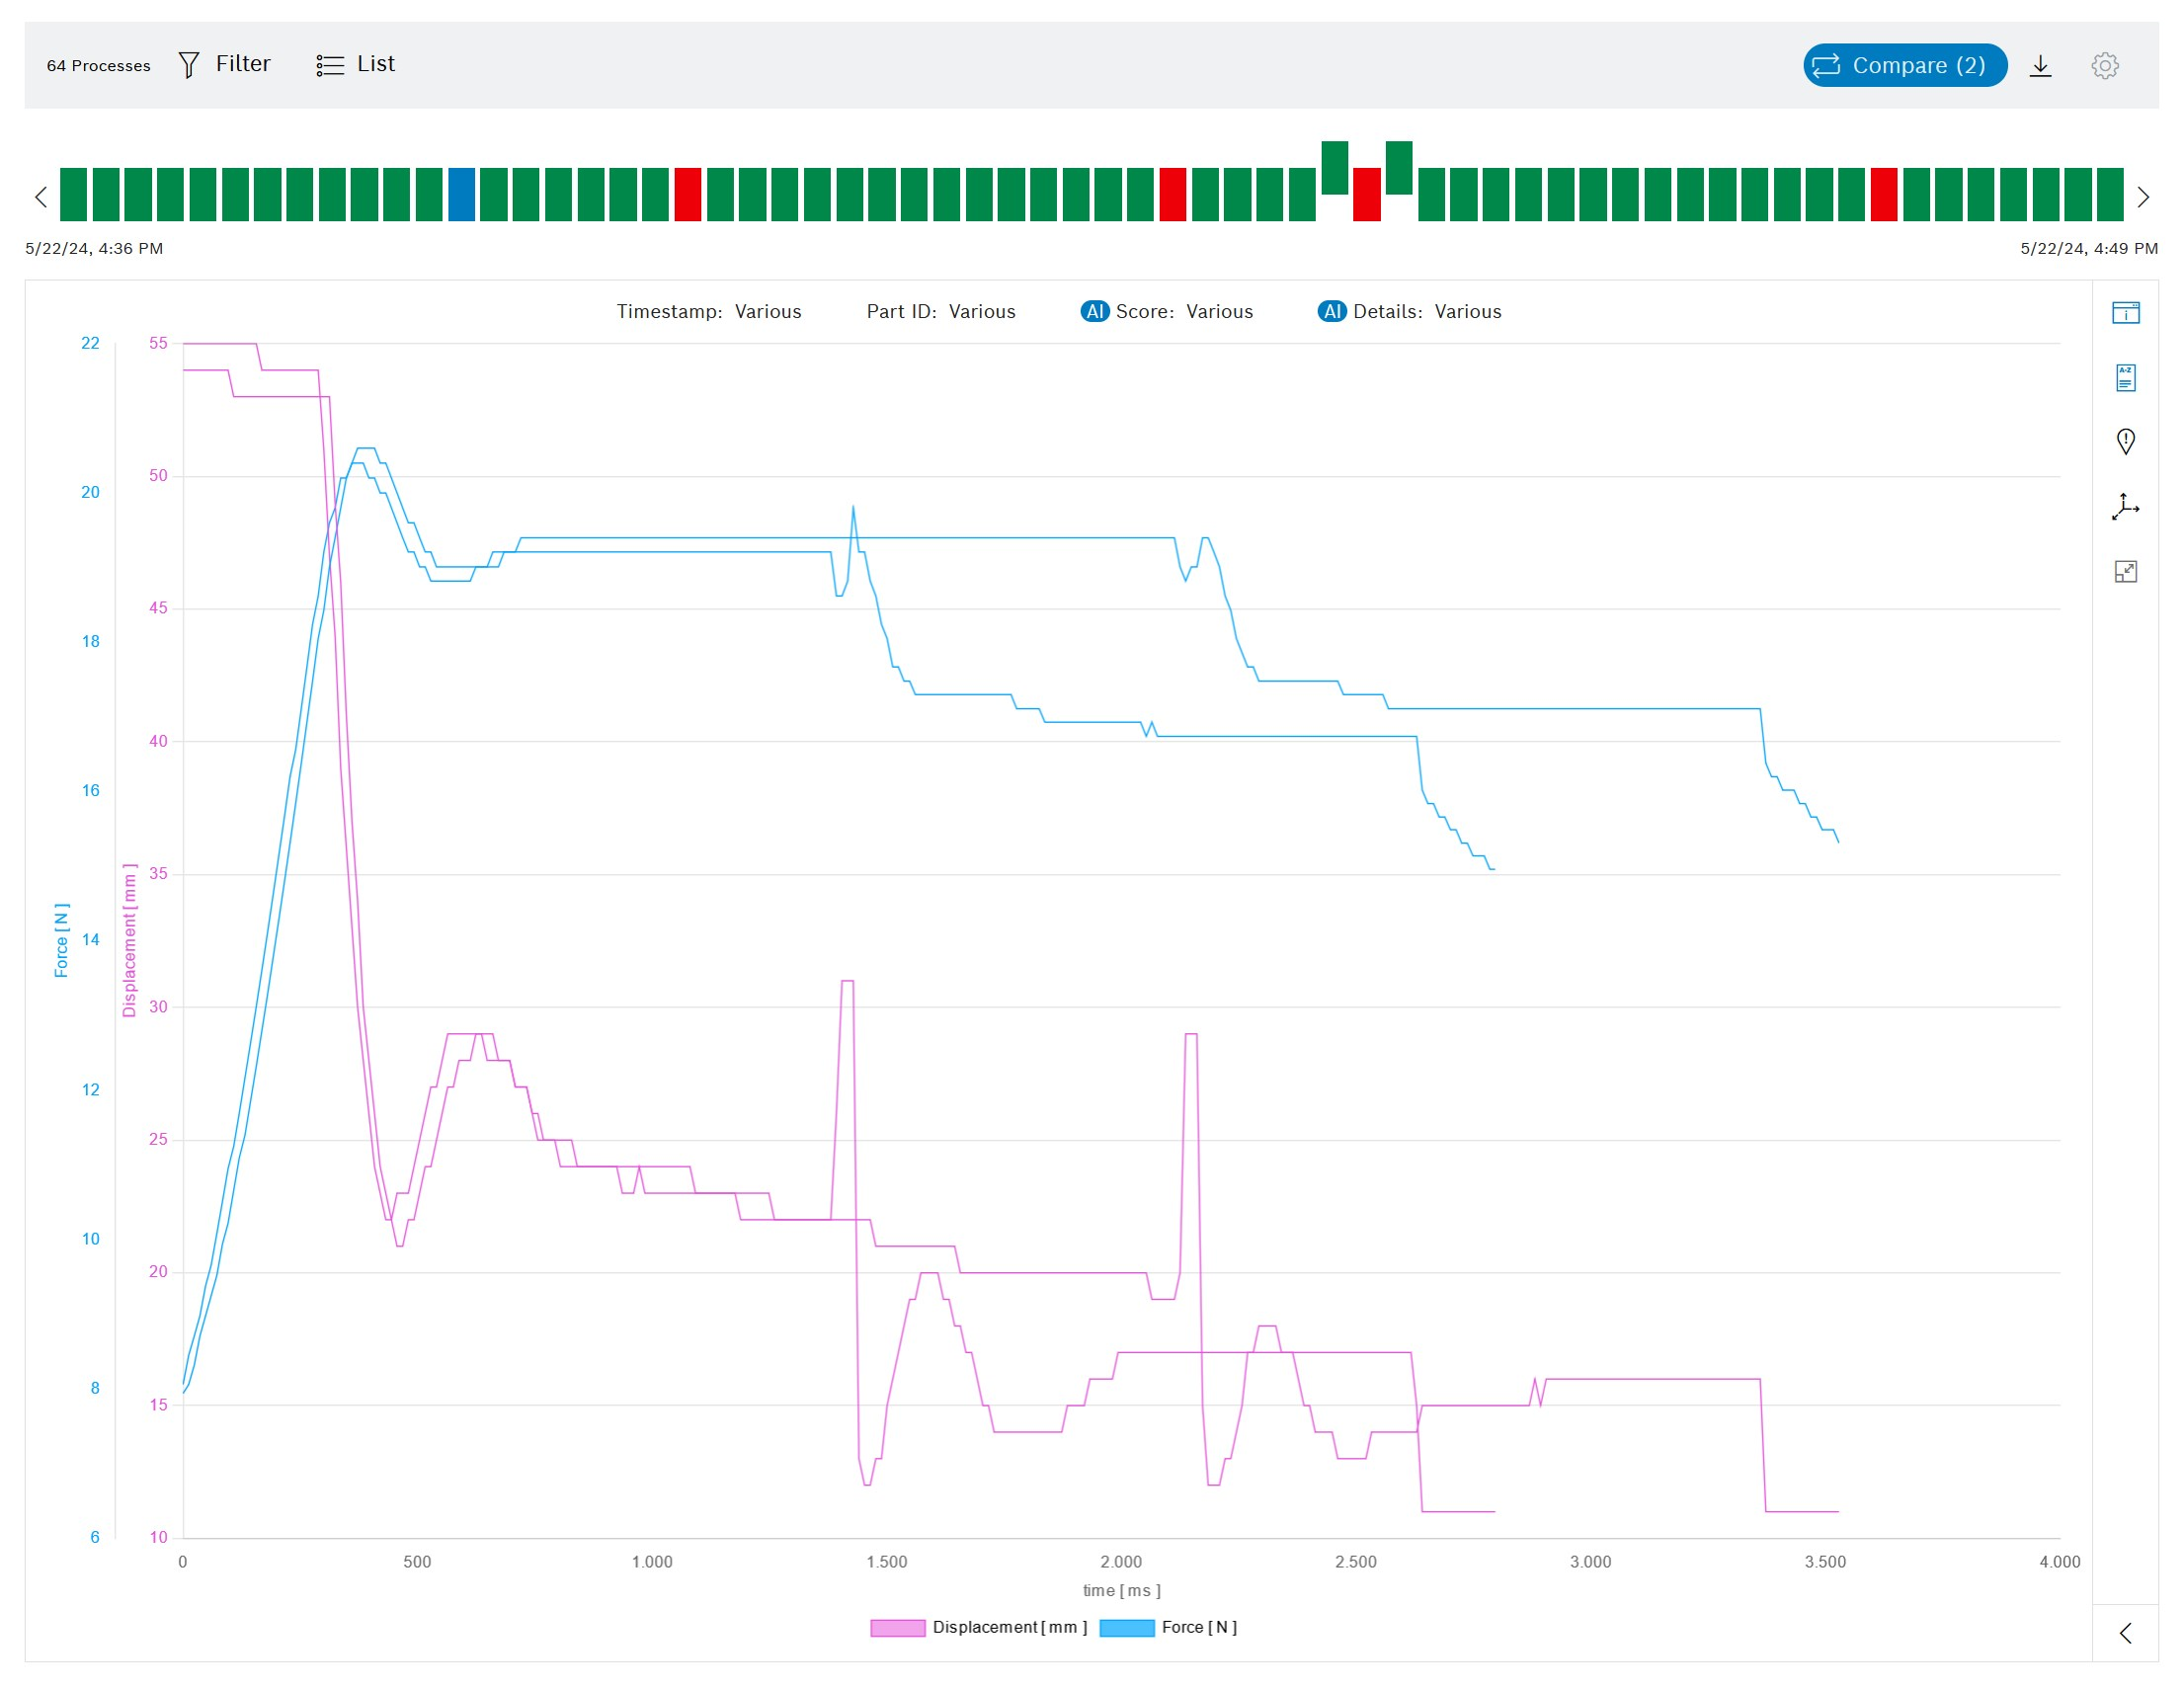
Comparison of the measured values using the curves in the diagram
-
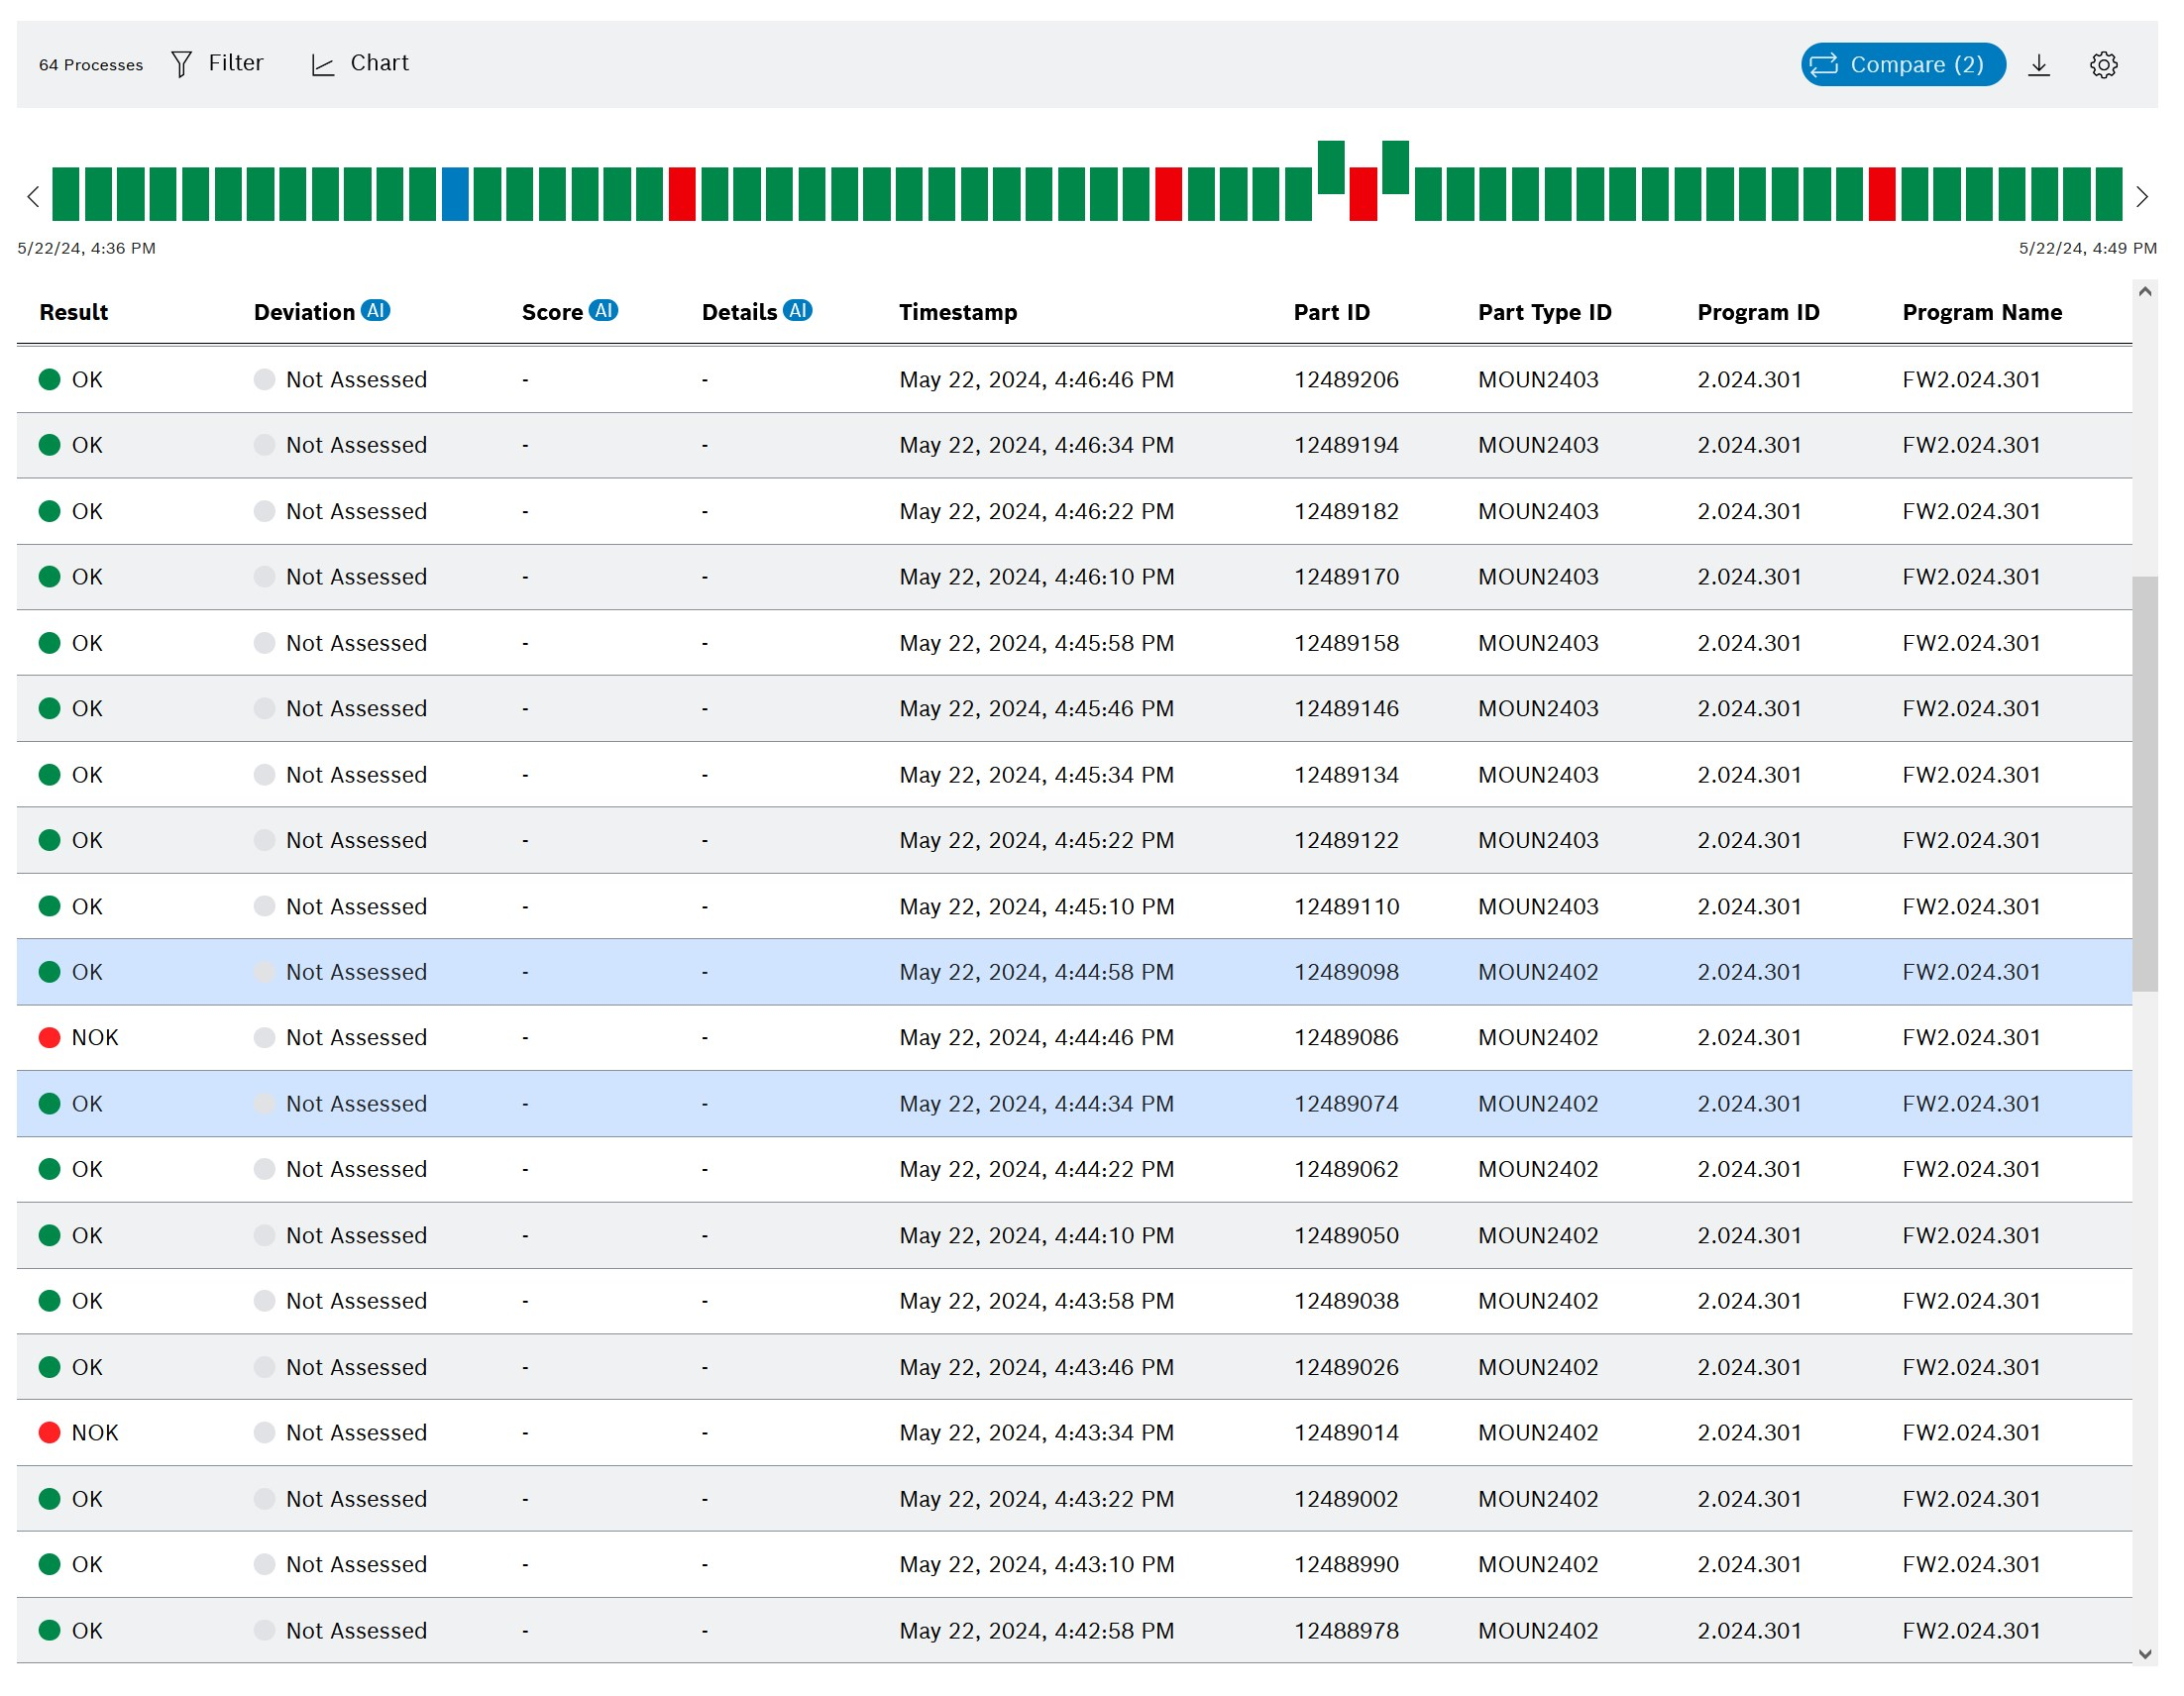
Comparison of the process data in the list
|
When many processes are compared, the performance depends on the browser, PC and operating system used. To improve performance, turn off the display scaling of the operating system. |
Prerequisites
-
Process Quality UserorProcess Quality Expertrole -
At least two measuring points are defined for the selected device type.
Two measuring points are required for the diagram view, however. Measuring points are defined in the Master Data Management module.
Procedure
-
Open the Process Quality menu.
-
In the overview, click the desired device tile:
Select device for analysis -
To filter the processes in the status bar, click
 in the header:
Use a filter -
Click Comparison
 in the header.
The background color of the icon is blue and the number of selected processes is displayed.
-
Select at least two processes in the status bar:
-
Option 1 : Single selection
Left-click a process in the status bar. -
Option 2 : Multiple selection
-
In the status bar, left-click on the first process of the desired process series.
-
Hold down the [SHIFT] key and click on the last process in the process series.
-
-
The selected processes are moved upward in the status bar.
The process curves of the selected processes are displayed in the diagram.
The selected processes are marked in blue in the list.
The number of selected processes is displayed in the header.
|
Two functions are available in Process Quality to keep track of multiple process curves: Highlight process curve permanently and Highlight process curve temporarily. |