Display measured values in the diagram
|
Only measured values with colored process curves can be displayed, not those with gray curves: Permanently highlight the process curve |
Prerequisite
-
Process Quality UserorProcess Quality Expertrole -
At least two measuring points are defined for the selected device type.
Measuring points are defined in the Master Data Management module.
Procedure
-
Open the Process Quality menu.
-
In the overview, click the desired device tile:
Select device for analysis -
To filter the processes in the status bar, click
 in the header:
Use a filter -
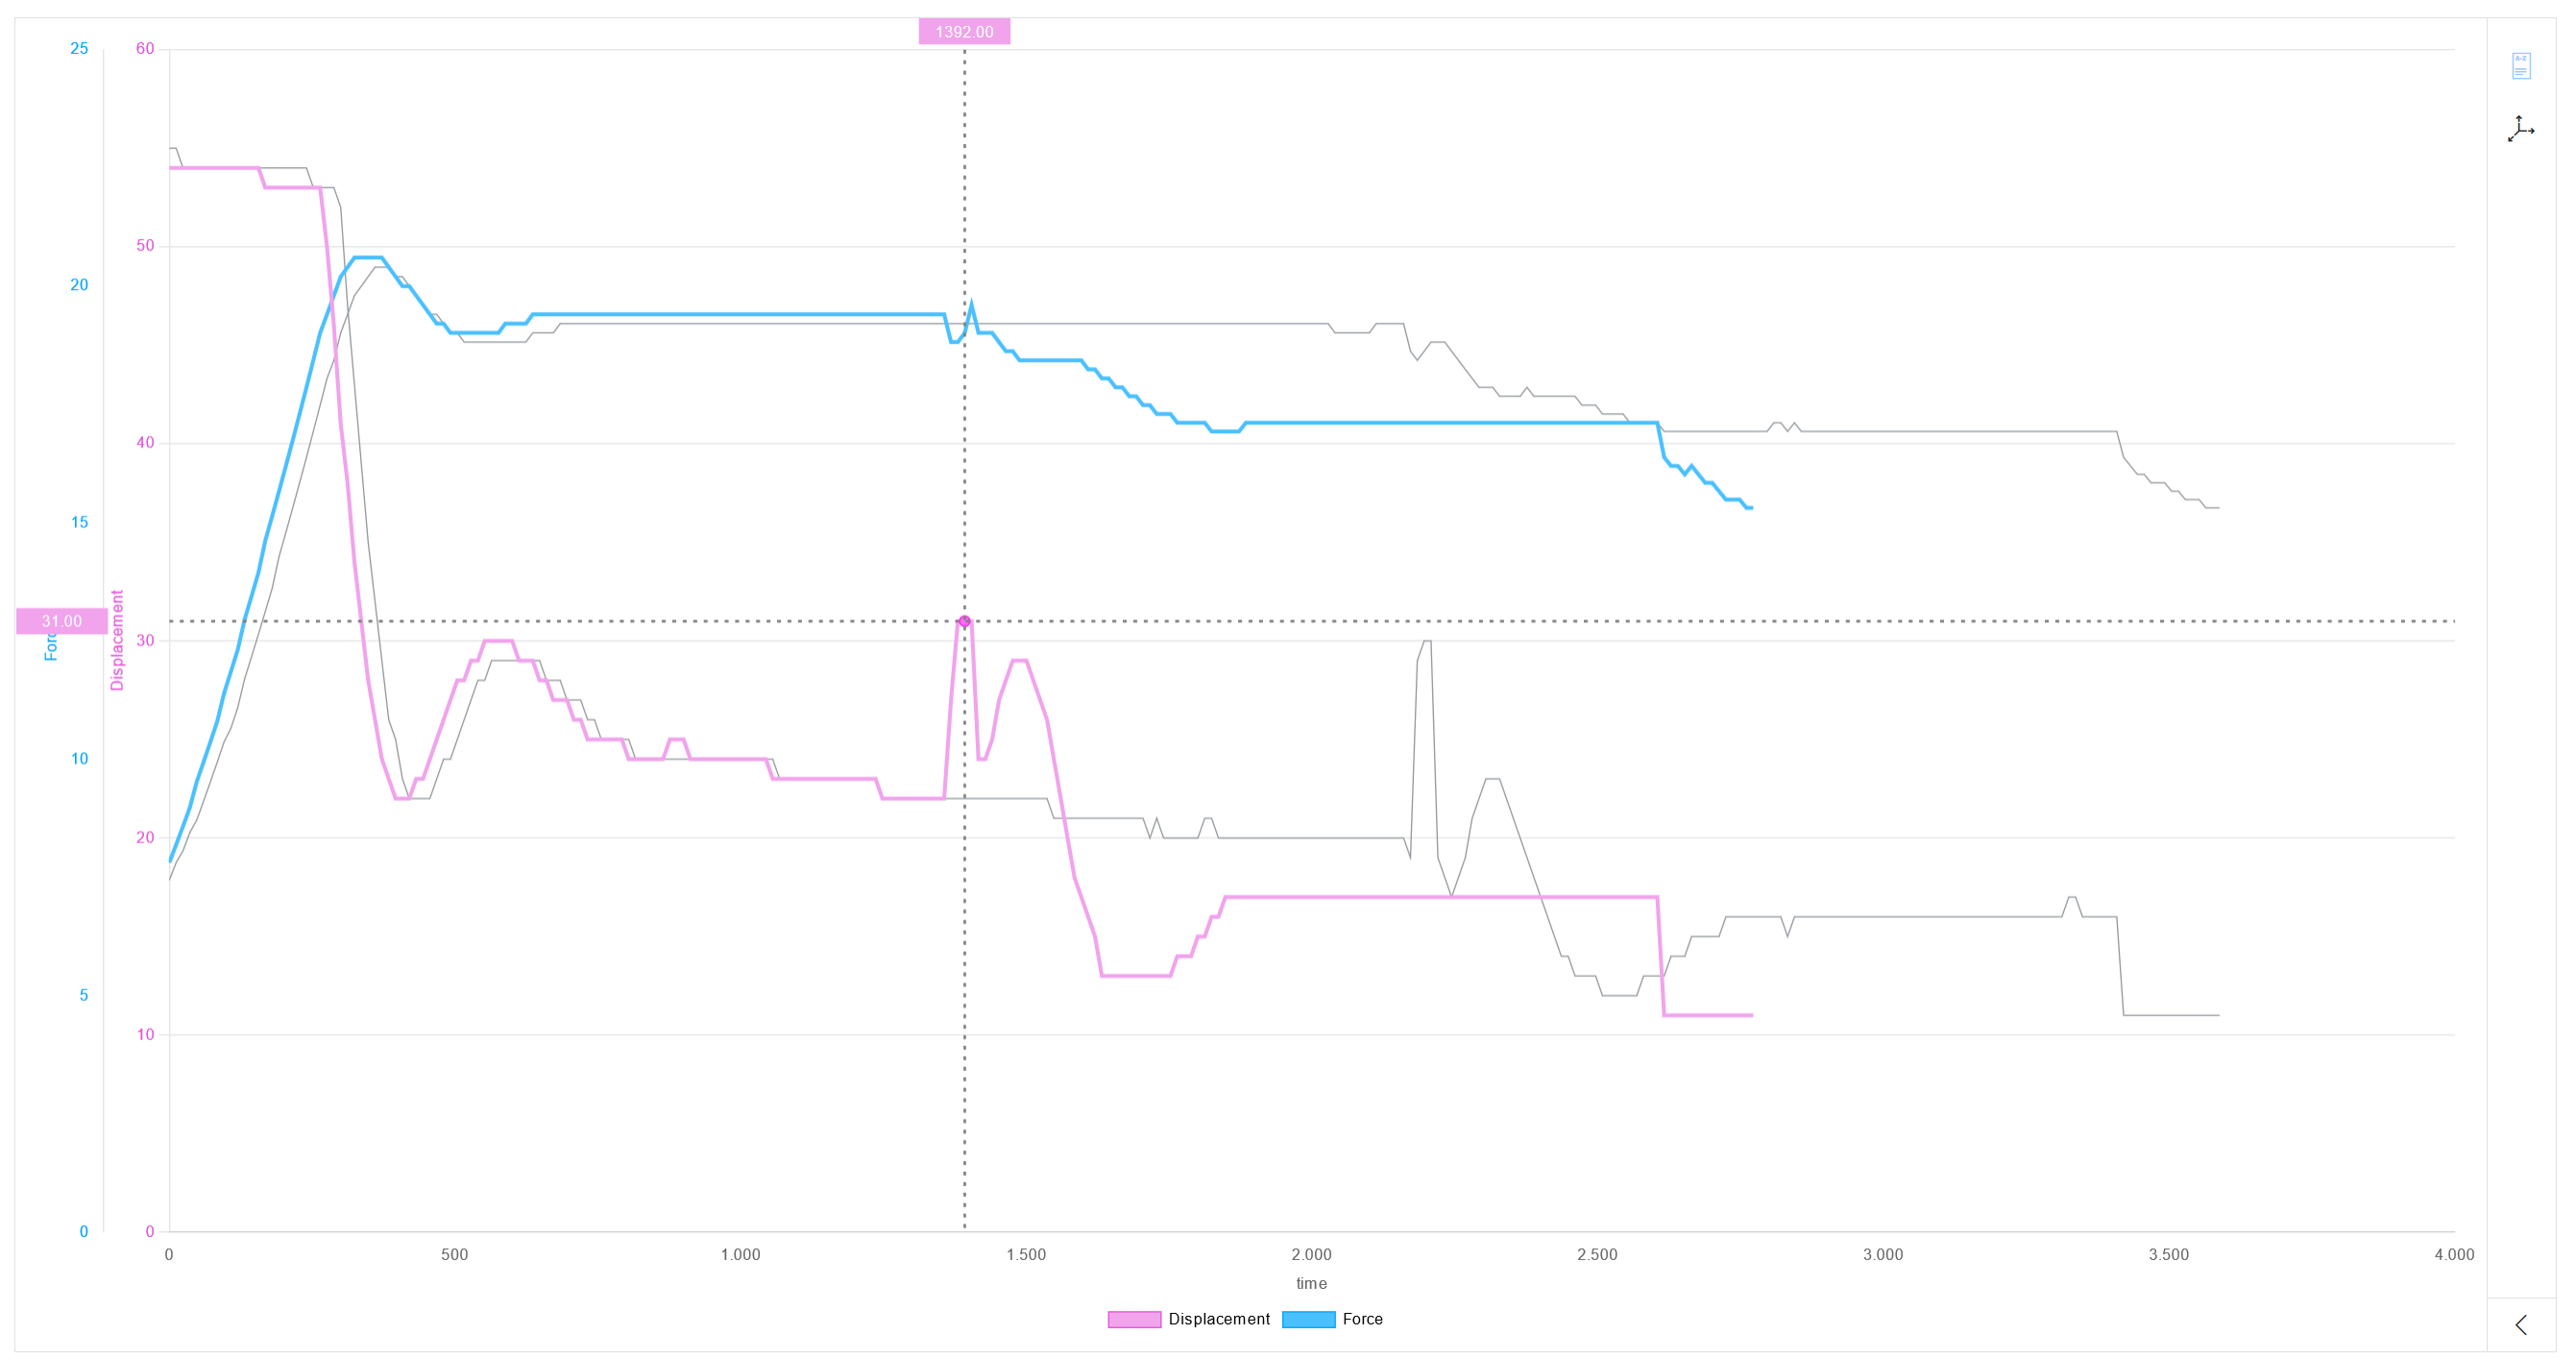
Move the mouse over the process curve in the diagram.
The process curve is highlighted. All other diagram elements change to gray.
The measured values of the X-axis and Y-axis are displayed in the color of the corresponding process curve.

|
In comparison mode, all process curves of the process are highlighted: Compare Processes |