Health verification endpoints
Service health verification endpoints
PQM provides kubernetes probes and a health endpoint. In contrast to the probes, the health endpoints are not intended to be used by the container management system, but for privileged (authorization required) users like operators or tools of an operator. For that reason the endpoints are exposed and will provide additional information than a simple ok, nok status.
Health endpoint
Authorization: Bearer Token
ResourceType: urn:com:bosch:bci:pqm:api
ResourceID: $process-quality.health
Role: PQM_OPERATOR
HTTP Method: GET
Path: /health
{
  "name": "Process Quality Module (PQM)",
  "instanceId": "2b0bc615-7ddb-48e9-b143-c630bb262106",
  "description": "Self contained system",
  "startupTime": "2023-12-18T08:56:03.231114292Z",
  "version": "3.2.0-rev",
  "ready": true,
  "health": "healthy",
  "dependencies": [
    {
      "name": "static-content",
      "description": "Webserver that provides static resources like the JS client application to the browser",
      "available": true,
      "details": {
        "instanceId": "N/A",
        "startupTime": null,
        "health": "healthy",
        "details": {},
        "version": "main",
        "dependencies": []
      }
    },
    {
      "name": "trinity-core-service",
      "available": true,
      "details": {
        "instanceId": "da050691-826a-4b9c-bfc5-6efaa28ee854",
        "startupTime": "2023-12-18T08:56:15.156302089Z",
        "health": "healthy",
        "details": {},
        "version": "main-20231214180723-DEV-SNAPSHOT",
        "dependencies": [
          {
            "name": "db",
            "available": true,
            "details": {
              "database": "Microsoft SQL Server",
              "validationQuery": "SELECT 1",
              "result": 1
            }
          },
          {
            "name": "diskSpace",
            "available": true,
            "details": {
              "total": 133003395072,
              "free": 22655647744,
              "threshold": 10485760,
              "path": "/app/.",
              "exists": true
            }
          },
          {
            "name": "migrationInfluxConnection",
            "available": true,
            "details": {
              "version": "1.7.11"
            }
          },
          {
            "name": "processInfluxConnection",
            "available": true,
            "details": {
              "version": "1.7.11"
            }
          },
          {
            "name": "livenessState",
            "available": true
          },
          {
            "name": "macma",
            "available": true
          },
          {
            "name": "mdm",
            "available": true
          },
          {
            "name": "portal",
            "available": true
          },
          {
            "name": "rabbit",
            "available": true,
            "details": {
              "version": "3.11.24"
            }
          },
          {
            "name": "readinessState",
            "available": true
          },
          {
            "name": "refreshScope",
            "available": true
          },
          {
            "name": "smdp",
            "available": true
          }
        ]
      }
    }
  ]
}
Kubernetes probes
-
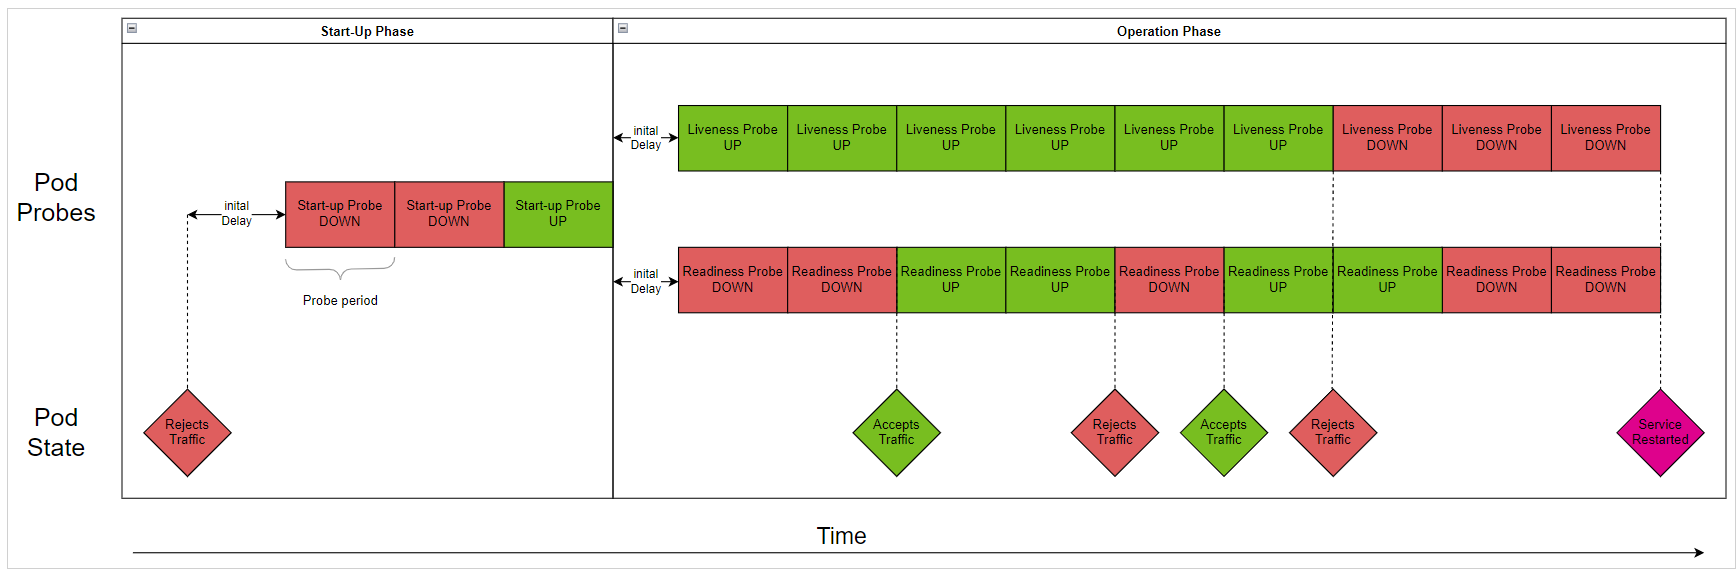
Liveness Probe A liveness probe can return
-
"Yes, I’m alive!" which will be evaluated by the runtime environment and no further action is executed.
-
"No I’m not alive!" which will be evaluated by the runtime environment. The container will be killed and restarted by the runtime environment.
-
Or it simply fails since the container is not able to respond to the probe for some reasons. The container will be killed and restarted by the runtime environment.
-
-
Readiness Probe A readiness probe can return
-
"Yes, I’m ready and can serve functionality to my clients!" which will be evaluated by the runtime environment and no further action is executed.
-
"No, I’m not ready!" which will be evaluated by the runtime environment and no traffic will be routed to the container. The runtime envrionment will ask again with a configurable amount of retries and with a configurable delay. If this probe fails everytime the pod will marked as unready.
-
Or it simply fails since the container is not able to respond to the probe for some reasons. The runtime environment will stop routing traffic to the container. The runtime environment will ask again with a configurable amount of retries and with a configurable delay. If this probe fails everytime the pod will marked as unready
-
-
Startup Probe A startup probe is intendet to suppress other probes during conatainers startup or initialization phases for preventing restarts. PQM uses the liveness probe as startup probe. It can return
-
"I’m succesfully started." From now on the runtime environment will start executing the liveness probes.
-
"I’m in the startup phase." the runtime environment will ask again with a configurable amount of retries and with configurable delay. If this probe fails everytime the pod might be restarted (depending on the pods restart policy).
-
Or it simply fails since the container is not able to respond to the probe for some reasons.
-
Table shows how PQM’s microservices will behave for several scenarios of infrastructure outages.
Startup
Scenario |
|
|---|---|
Impact |
|
General Behaviour |
- |
Readiness Endpoint |
http response: 503 |
Liveness Endpoint |
http response: 503 |
RabbitMQ
Scenario |
|
|---|---|
Impact |
|
General Behaviour |
|
Readiness Endpoint |
|
Liveness Endpoint |
|
Database
Scenario |
|
|---|---|
Impact |
|
General Behaviour |
|
Readiness Endpoint |
|
Liveness Endpoint |
|
Influx
Scenario |
|
|---|---|
Impact |
|
General Behaviour |
|
Readiness Endpoint |
|
Liveness Endpoint |
|
The following diagram shows how Kubernetes probes pod health verification endpoints to determine the pod state.