SOT
    • Introduction
    • User manual
      • Basic operation
        • Create and delete a device as a favorite
        • Use the filter function
      • Process
        • Compare processes
        • Change axes in the diagram
        • Show and hide axis in the diagram
        • Show special values
        • Display measured values in the diagram
        • Display process data in the diagram
        • Displaying diagram content
        • Permanently highlight a process curve
        • Temporarily highlight a process curve
        • Monitoring processes
        • Configure columns
        • Export process data
    • Operations manual
      • Overview
      • System architecture and interfaces
      • System requirements
        • trinity/static-content
        • trinity/trinity-core-service
        • trinity/trinity-gateway-service
      • Migration from previous versions
        • Influx database migration
        • Deletion of an old CPM installation
      • Setup and configuration
        • AI add-on: Process Intelligence
        • Database configuration
        • Port configuration
        • HELM configuration
        • Application account roles provided
        • Relational database
        • General logging
        • General OpenTelemetry
        • trinity/static-content
        • trinity/trinity-core-service
        • trinity/trinity-gateway-service
      • Start and shutdown
      • Regular operations
      • Failure handling
        • Processes are not received
        • Module is not visible in the Web Portal
        • How to verify if the broker is out of sync
        • Devices are missing
      • Backup and restore
      • Logging and monitoring
        • Observability
        • Logging characteristics
        • Logging format
        • Logging level
        • Required monitoring
        • Request-based logging format
        • Security logging format
        • Lifecycle logging format
        • Health verification endpoints
      • Known limitations
    • API documentation
Process Quality
  • Smart Operations Toolkit
    • Deviation Processor
    • Multitenant Access Control
    • Notification Service
    • Ticket Management
    • Web Portal
  • Shopfloor Management
    • Andon Live
    • KPI Reporting
    • Operational Routines
    • Shift Book
    • Shopfloor Management Administration
  • Product & Quality
    • Process Quality
    • AI Services
  • Machine & Equipment
    • Condition Monitoring
    • Device Portal
  • Enterprise & Shopfloor Integration
    • Information Router
    • Master Data Management

SOT Learning Portal

  • Process Quality
  • Operations manual
  • Failure handling
  • How to verify if the broker is out of sync

How to verify if the broker is out of sync

If AMQP cluster runs on a single node, a restart is enough to bring the cluster in an invalid state, causing various problems. Identifying if the broker is in an invalid state is sometimes tricky.

By following the steps, you can identify an invalid state:

  1. Open https://host:port/rabbitmq/#/

  2. Enter credentials (to be found in your deployment configuration)

  3. Does the overview page of the AMQP broker management UI indicate an invalid state? All nodes should have a green state!
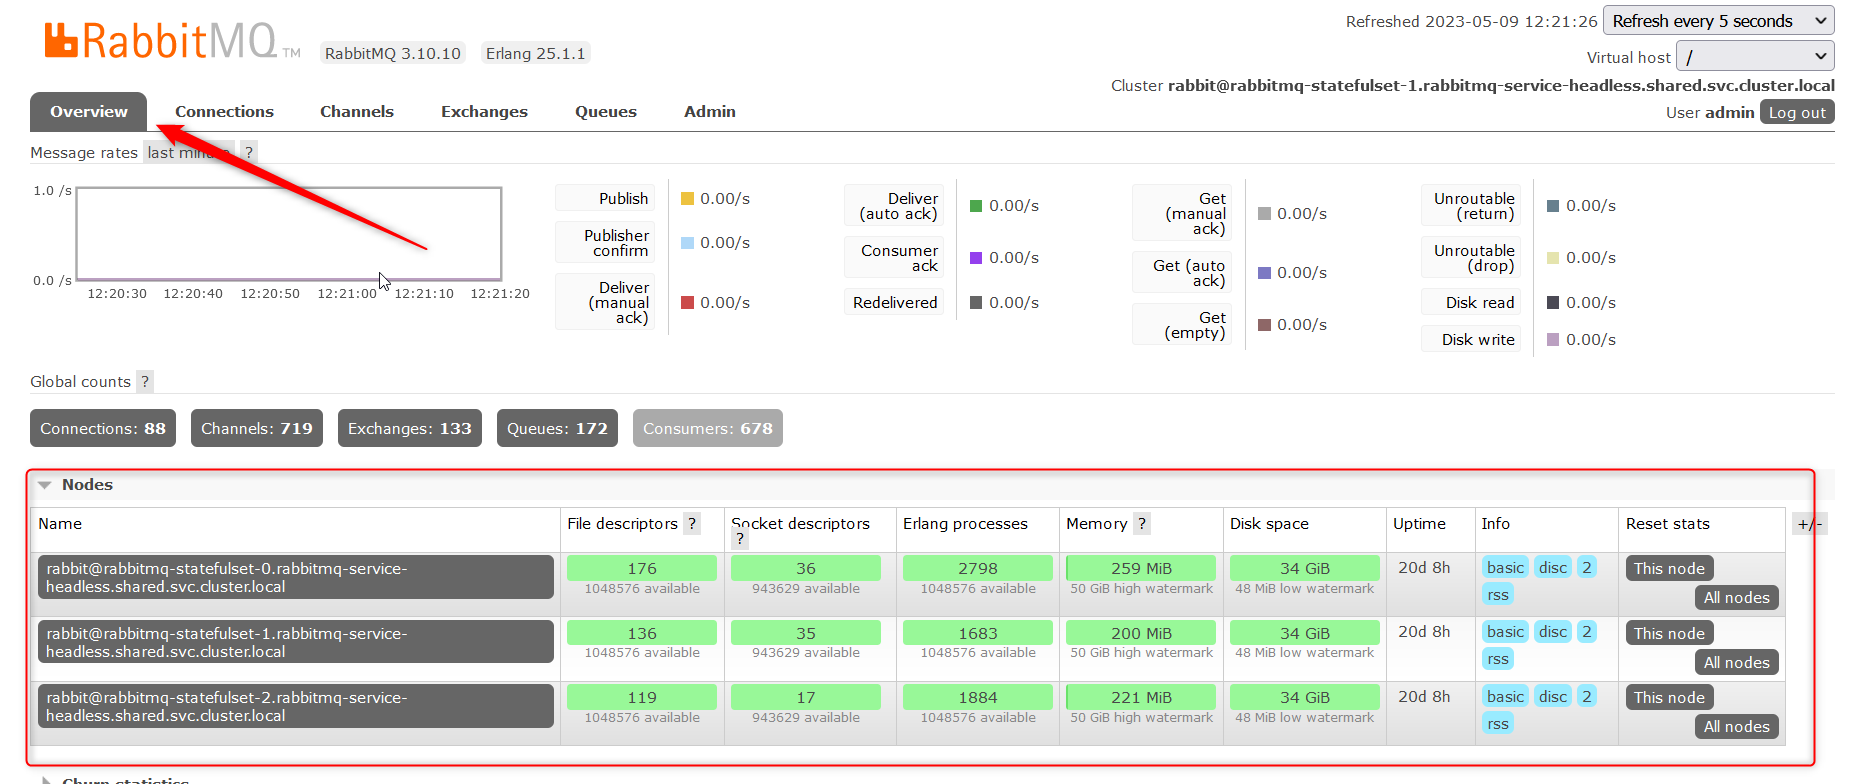
    broker out of sync 00
  4. Are all queues synchronized over all nodes?

    • Open https://host:port/rabbitmq/#/queues

    • All nodes should have the blue "+2" and "mirror-queue" icons
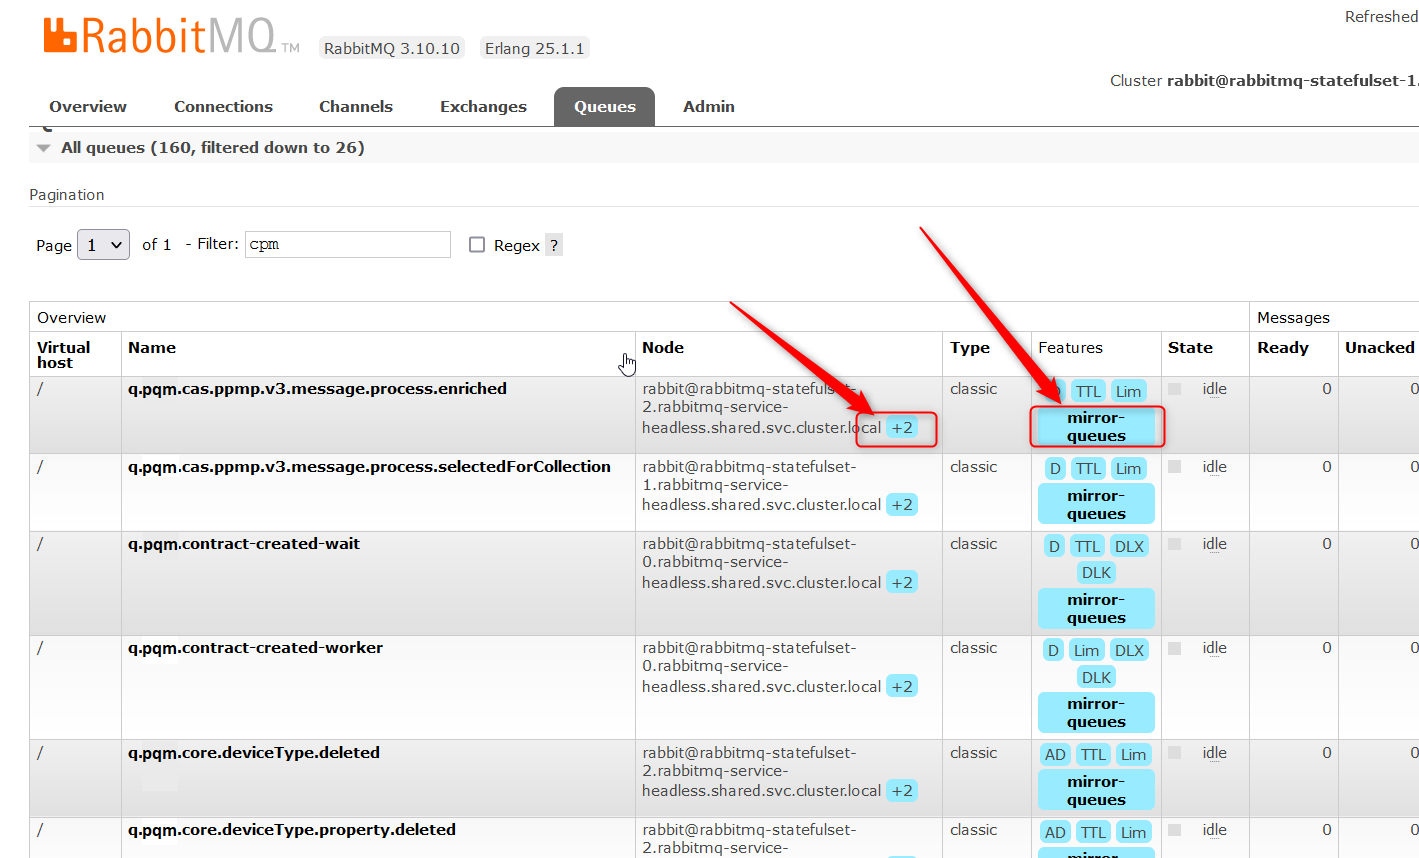
      broker out of sync 01
  5. Are the exchanges available over time?

    • If the exchanges are not synchronized over all nodes, they appear and disappear.

    • It is best to filter for "pqm" and see if all exchanges stay (2 minutes is enough).

    • This can also be observed if a queue is opened. The bindings to the exchanges will appear and disappear.

Contents

© Robert Bosch Manufacturing Solutions GmbH 2023-2026, all rights reserved

Changelog Corporate information Legal notice Data protection notice Third party licenses