Desktop Client for Order Management
The Desktop Client for the Order Management module is used to manage production orders and materials for lines. The clients are installed on a PC and connected to the Order Management database.
Two clients with different layouts are available:
-
Order Management ProClient
Default settings are optimized for Order Management -
Order Management SRSClient
Default settings are optimized for the Smart Replenishment use case
Both clients have the same functionality. Their layout can be customized.
For the purpose of this documentation, the names of both clients are used interchangeably, unless otherwise specified.
Terminology
| Term | Description |
|---|---|
DMC |
Data Matrix Code is one of the most common 2D barcodes. It is used for coding Mat Labels in the Mat Label standard. |
Mat Label |
A labeling standard, which defines data that is to appear on a material label. It is used for tracking, tracing and identifying all components. (See Mat-Label specification). |
Installing the Order Management ProClient
The Order Management ProClient is installed and configured using the MES Installer.
file://///BOSCH.COM\DfsRB\DfsDE\DIV\BCI\Nexeed\MES\Public\Docu\MES Installer
Note
When installed with the MES Installer, obsolete Install.bat files may be saved along with current files. This causes errors during installation. Therefore, during installation, pay attention to the following:
-
Do not interrupt the automatic installation routine.
-
Do not run the Install.bat files.
Uninstallation
The Order Management ProClient cannot be uninstalled using the MES Installer.
ClickOnce clients
ClickOnce clients can be configured and published using the MES Installer.
Open and exit the Order Management ProClient
-
Start the Order Management ProClient by double-clicking on the icon.
Or:
Find and open the Order Management ProClient using the Windows search feature.
-
Proceed as follows to change the language:
-
Open the
 Select language… menu in the bottom right.
 -
Select the required language from the drop-down list.
-
Click OK to change the language.
-
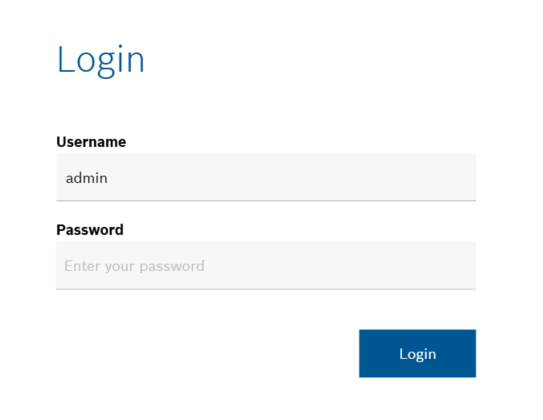
-
Click Login to open the client and Enter user name and password.
The menu that was open when the Order Management ProClient was last shut down is displayed.
-
To load a layout, go to Loading a default layout.
Overview of the user interface
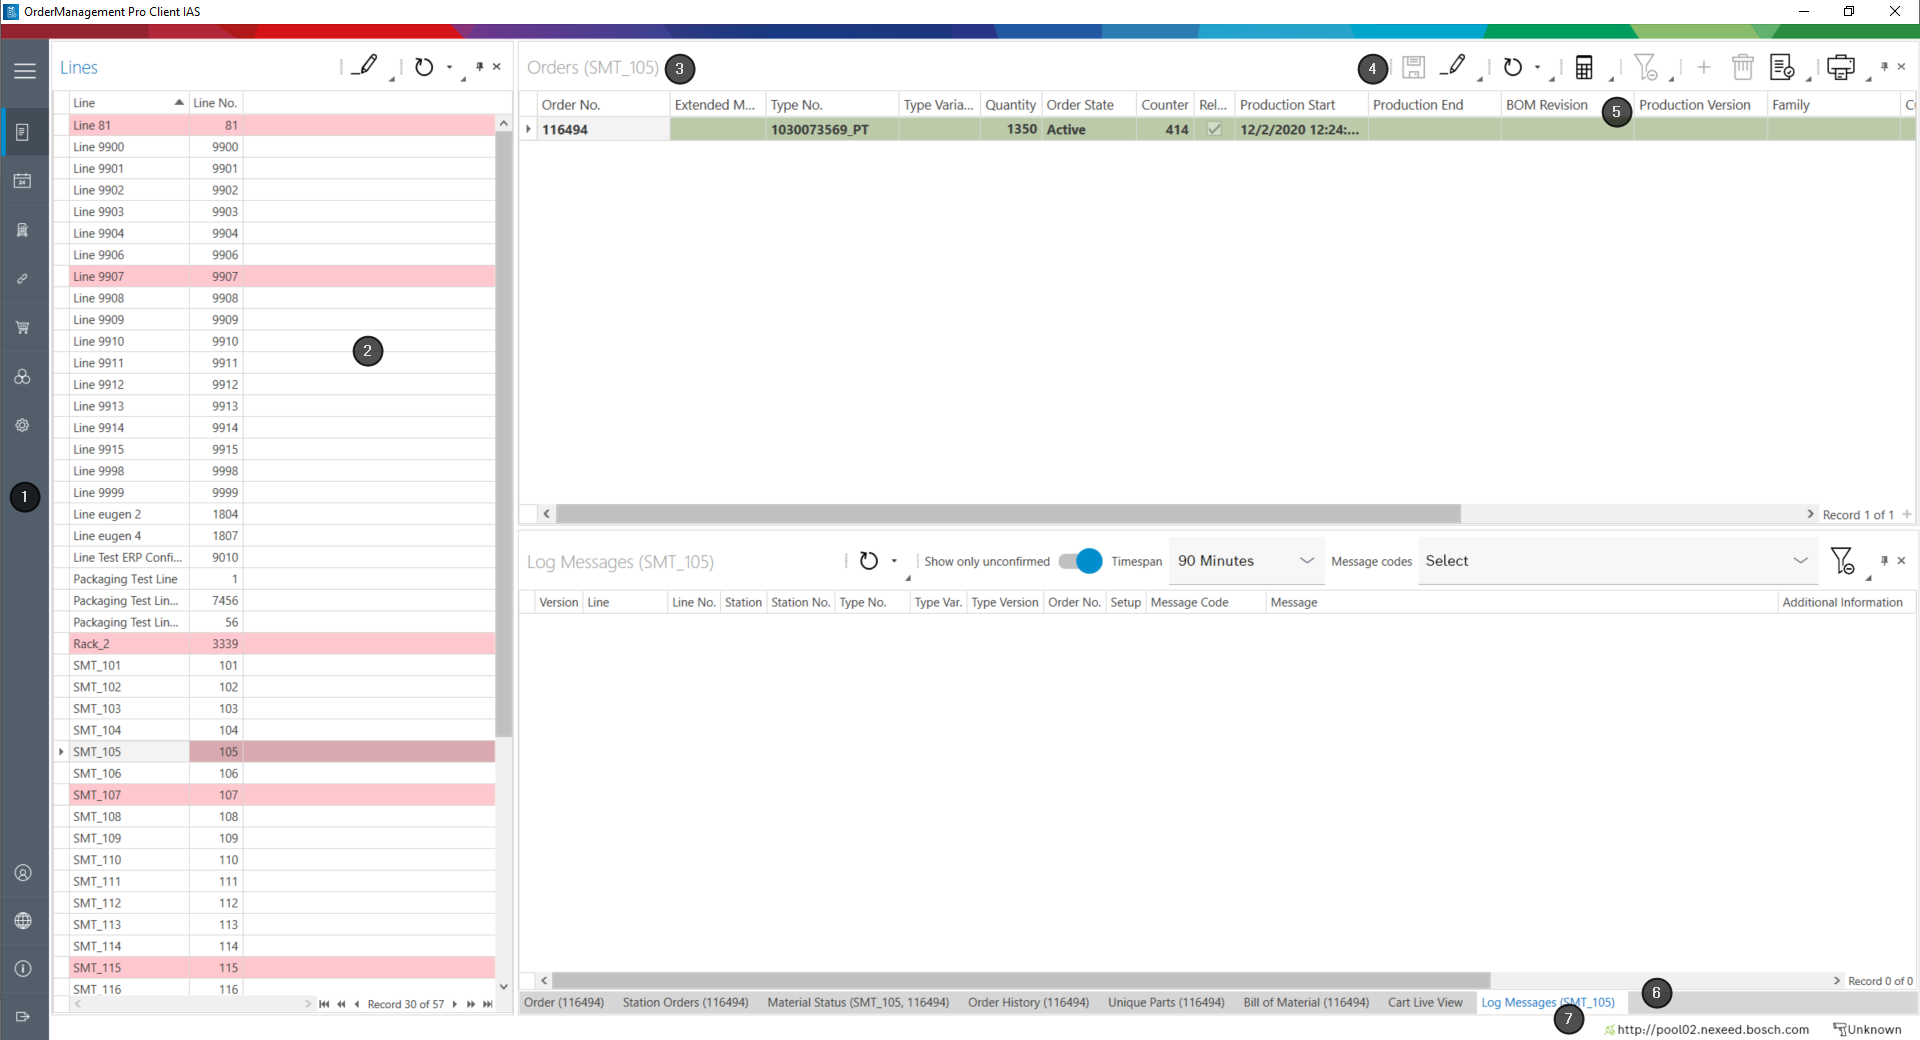
| Step 1 | Description |
|---|---|
|
Menu |
|
Panel/window |
|
Window title |
|
Toolbar |
|
Table header |
|
Hidden windows |
|
Status bar |


Menu
In the menu, the menu options are used to open the functions that are displayed on the main screen.
The menu can be maximized with  and minimized with
  .
.
The following menu options are displayed:
| Menu option | Description |
|---|---|
with job overview |
Create and manage orders |
Graphical Order Display |
View the orders in the calendar, for a quick overview of the status of the orders |
Cart Management |
Create and manage setup facilities |
Splice Prediction |
Display splicing information, for example information about material, line and station, splicing reserve, estimated time to next splicing |
Material Orders |
View and manage material orders for lines |
Material Handling |
View and manage material replenishment for lines |
Admin settings |
Configure the Order Management ProClient |
admin |
Log on as an administrator. |
Select Language… |
Select the language for the Order Management ProClient. |
About… |
Information about the Order Management ProClient, for example display version, manufacturer, and contact information. |
Exit |
Exit the Order Management ProClient. |
Panel
The main screen is made up of panels. They are outlined with a thin gray line. One or more windows are assigned to a panel. Only one window is displayed at a time. The title of windows that are not displayed is shown at the bottom of the panel. Click on the window title to open the window.
Panels can be fixed, in other words always displayed or hidden. The title of hidden panels is displayed on the right side of the menu. Hidden panels can be opened by clicking on the title.
Right-clicking on the window title opens a context menu, which can be used to arrange panels as required. The customized layout can be saved.
Window
The menu-specific contents are displayed and edited in windows. A window has a title and a toolbar. The contents are displayed in the form of tables or graphs.
Toolbar
Each window has a toolbar with buttons for operation. Additional buttons can be added using the small triangle in the lower right corner of an icon.
The following symbols are often used:
| Symbol | Description | ||
|---|---|---|---|
|
Add an item to the window. |
||
|
Save all changes in the window. |
||
|
Enable editing. If editing is enabled, changes can be made in the window (e.g. Lines window: Switch the selected line to maintenance mode). |
||
|
Update the data in the window.
The downward triangle next to the icon opens a pop-up window to enable the automatic update. 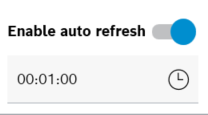
The automatic update is activated with the switch and the activation interval (hh:mm:ss) is adjusted using the keyboard or using |
||
|
Check the saved settings for contradictions. The results are displayed in a separate message window. If there are conflicting settings, they are sorted by line. |
||
|
Delete the selected item in the window.
|
||
|
Remove all filter criteria applied in the window.
|
||
|
Open the print preview for the window. |
||
|
Automatically hide or always display the panel/window. The title of a window that is automatically hidden appears on the edge and can be displayed by moving the mouse over it. |
||
|
Close the panel/window. The title of the panel/window appears at the edge of the panels. A closed panel/window can be displayed again by clicking on the title. |


Table header
The table header displays the column titles of a table. Right-clicking on the table header opens a context menu that can be used to adapt the table (e.g. displayed columns and sorting).
Status bar
The status bar shows the status of the connection to the database and scanner.
Scanners can also be set up using the status line.
Lines window
The Lines window is available in every menu except in the Cart Management menu and shows all production lines available in the Order Management ProClient for order and material management. The functions displayed on the main screen are applied to a line selected in the Lines window.
Toolbar
The toolbar in the Admin Settings menu has additional buttons for configuring the lines:
| Symbol | Description |
|---|---|
|
Export lines to an XML format file. You can choose whether line-specific settings, locations and location-specific settings should be exported. It is not possible to export only the location-specific settings. |
|
Import one or more lines from a file in XML format. |
|
Create a line in the Order Management ProClient. |
|
Add location to the selected line. |

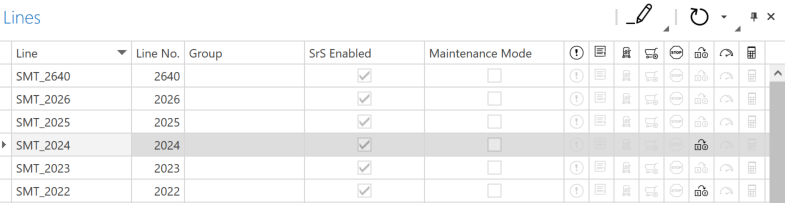
Table
Columns with icons can be displayed in the table.
If the icons are black (and not grayed out), there is a warning about the line. The tooltip of the icon shows a description of the warning.
Column titles in the Lines window:
| Element/Icon | Description | ||
|---|---|---|---|
line |
Line name |
||
Line number |
Number of the line |
||
Group |
Name of the line number group |
||
SrS enabled |
Smart Replenishment Service (SrS) indicator enabled or disabled The SrS calculates the material consumption based on planned orders.
|
||
Maintenance Mode |
Maintenance mode display enabled or disabled When maintenance mode is enabled, the line is highlighted in red. |
||
|
"Missing Material " warning The status of the material is queried for each material calculation. This warning indicates that there is not enough material on the line to complete the order. |
||
|
"Not enough orders found" warning The status of orders is queried for each material calculation. This warning indicates that there are not enough released orders on the line to fulfill the forecast period.
|
||
|
"Cart Management Configuration Error " warning The status of cart management is queried for each material calculation. This warning indicates that there are differences between the configured and the actual changeover cart for the first order on the line. |
||
|
"Order maximum reached " warning The status of the material order is queried for each material calculation. This warning indicates that the maximum order threshold configured for the line is exceeded by the number of materials required for a single facility.
|
||
|
"No order found to activate " warning The status of the released orders is queried each time an order is activated. This warning indicates that a new order is to be activated on the line, but no matching order has been found. |
||
|
"The line produces a different product than specified in the production schedule" warning The status of the production schedule is queried each time an order is activated. This warning indicates that the order to be activated is not the first released order on the line. |
||
|
"Quantity produced exceeds target quantity " warning The status of the produced quantity is queried cyclically. This warning indicates that the counter of the first station on the line has exceeded the planned quantity of the order |
||
|
"Material calculation (partially) failed " warning This warning indicates that the material calculation for the line failed. |


Context menu
If editing is enabled with  in the Lines window, a context menu can be opened up in the line row.
The menu options in the context menu depend on the selected menu:
-
with job overview
-
Switch maintenance mode
Enables or disables maintenance mode for the selected line. -
Display splice prediction
Switches to the Splice Prediction menu.
-
-
Graphical Order Display , Splice Prediction , Material Orders and Material Handling
-
Switch maintenance mode
Enables or disables maintenance mode for the selected line.
-
-
Admin settings
-
Switch maintenance mode
Enables or disables maintenance mode for the selected line. -
Delete the selected lines
Multiple lines can be selected using [CTRL]. -
Add location to selected line
Adding a location to a line -
Duplicate
Creating a line
-
Basic operation: setting up the toolbar
Buttons can be displayed and hidden in the toolbar. The available buttons depend on the contents of the window.
Description of the most common buttons:
The buttons are grouped together, separated by a vertical gray line (e.g. the General group contains the Save and Edit buttons).
-
Open the window.
-
To show or hide a group, right-click an icon in the toolbar to open the context menu and select the group name.
-
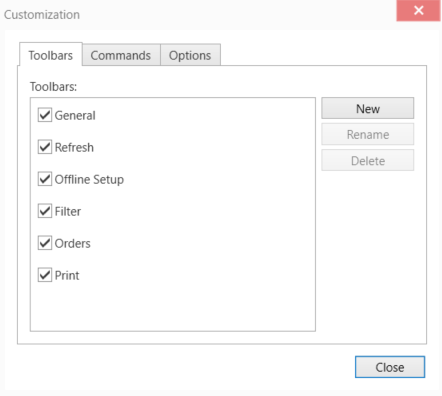
Proceed as follows to customize a group:
-
In the toolbar, right-click to open the context menu and select Customize….
Or:
Use the triangle at the bottom left to select Customize > Customize…..
-
To move a button to another group, drag and drop the button into the group.
-
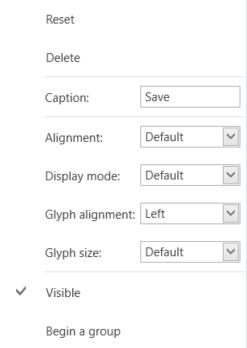
Open the context menu by right-clicking the icon.
-
To move the button to a new group, select Begin a group.
-
To hide the button, select Visible.
-
-
To display tooltips, in the Options tab, check the checkboxes in Tooltips.
-
Accept the changes using Close.
The toolbar is displayed as set up.
-
To save the changes, continue with Saving a layout.
Basic operation: printing or exporting in PDF format
The displayed contents of windows can be printed or exported in PDF format.
-
Open the window.
-
If necessary, set up the table or graphical display.
-
Click
 to open the print preview.
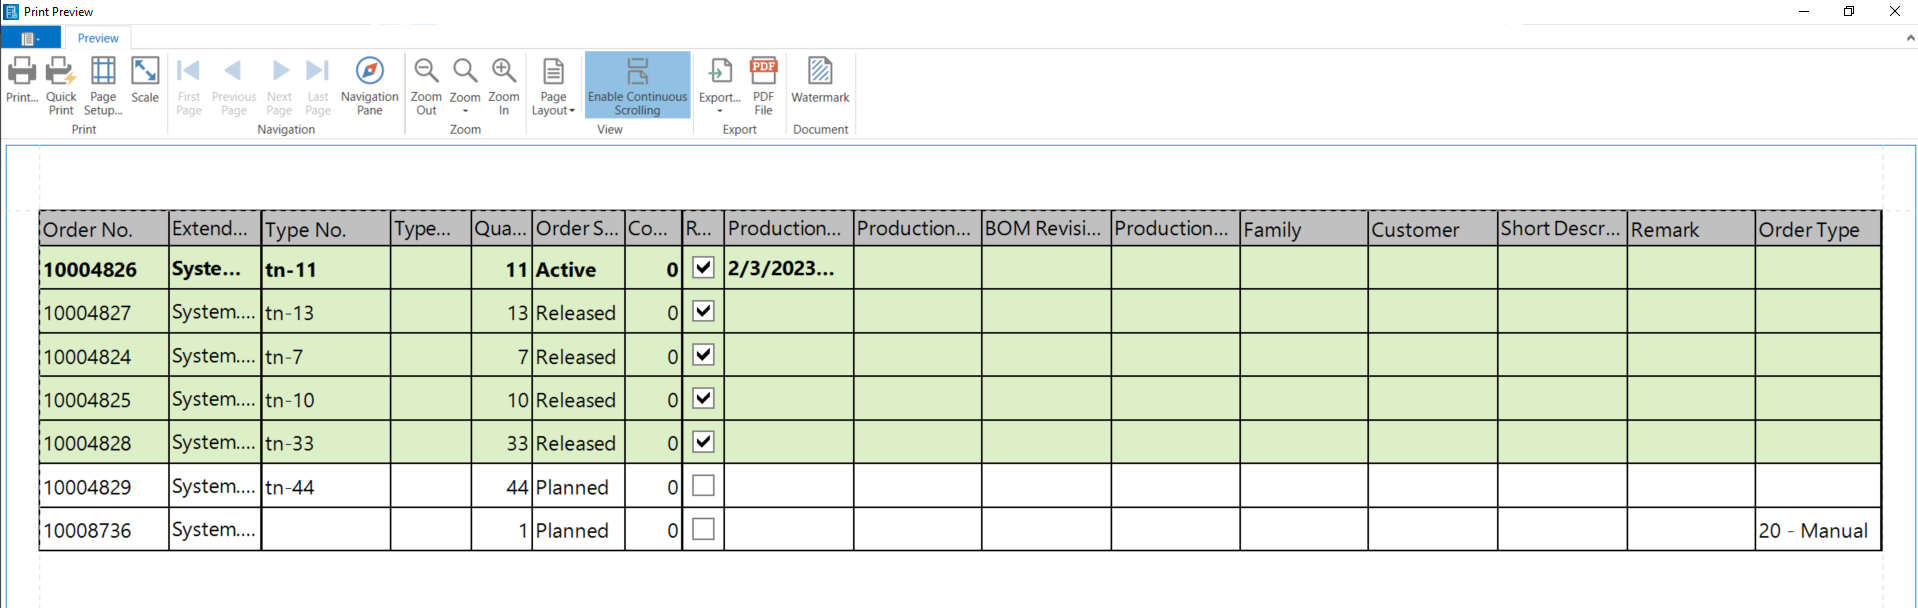
-
If necessary,adjust the paper size using Page Setup….
-
To print the document, open the print menu using Print… , make any necessary settings and print by clicking OK.
Or:
To save the document in PDF format, click PDF File to open the Export Document… dialog box, select the location and export by clicking OK.
The document is printed or stored in the selected directory.
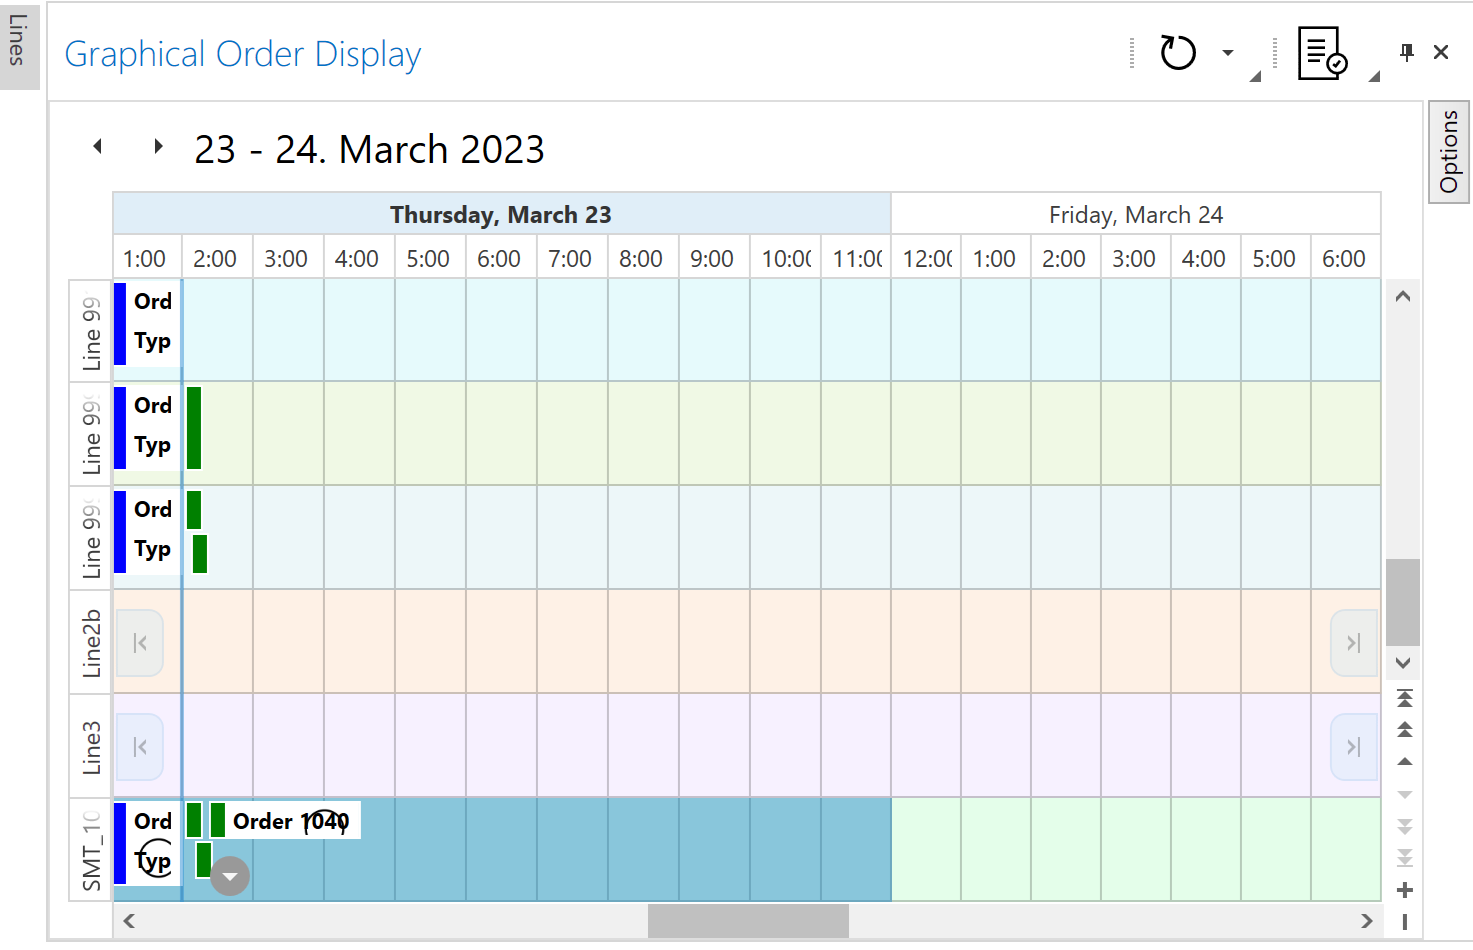
Graphical order display menu
The Graphical Order Display menu shows the progress of the Order Management in a table. Completed orders can be viewed on a timeline. Various filters and settings can be used to adjust the display.
Clicking on an order displays the order details in the Order window. You can filter the lines you want to display by clicking the Options window.
Context menu
Specific icons and toolbar items:
| Element/icon | Description |
|---|---|
|
View orders for the current date. |
|
Display orders from a specific date. |
Timescale > |
Select the timescale of the display. |
Show timescale > |
Select whether the current timescale is displayed in the table header. |

Splice prediction menu
Splicing is the joining of two materials, usually in the form of rolls, tapes or cords.
|
Materials can only be spliced if one or both materials have a minimum length. The total length of the material after splicing must be taken into account during the production process. |
The Splice Prediction menu has two windows:
-
Line
The line for which the splice prediction is to be displayed can be selected. -
Splice Prediction
The splice prediction data for the selected line is displayed in a tree structure sorted by line group.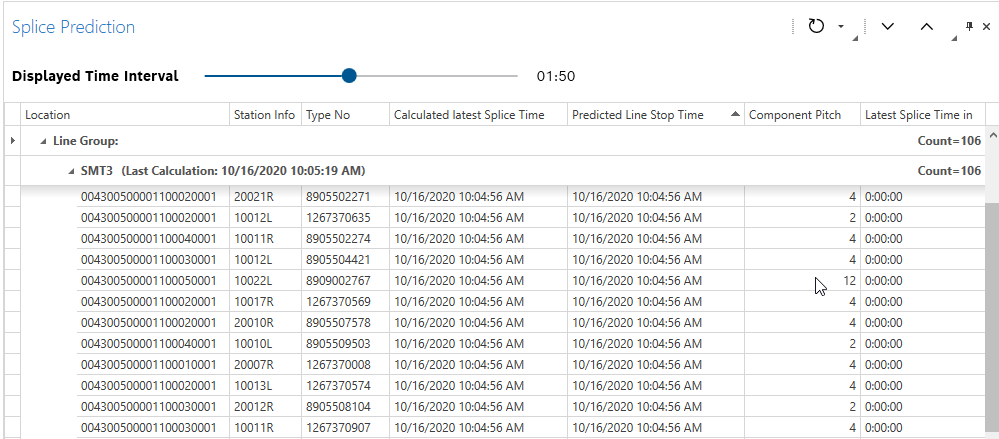
Specific icons and elements in the Splice Prediction window:
| Icon/element | Description | ||
|---|---|---|---|
|
Open the line grouping in the tree structure. |
||
|
Close the line grouping in the tree structure. |
||
|
Slider for the Displayed Time Interval Filters the Calculated latest Splice Time column on the basis of the last calculation. Only splice prediction data for the selected time interval is displayed. |
||
Location |
Location where the material is spliced |
||
Line |
Track of the line to be spliced |
||
Material No. |
Material number of the material being spliced |
||
Calculated latest Splice Time |
Difference between the last possible splice time and the last calculation time. If the time has elapsed, it may not be possible to successfully splice the material because the material length is inadequate. |
||
Predicted Line Stop Time |
The time when the production line must be interrupted due to a lack of material |
||
Component Pitch |
Distance between two materials being spliced in millimeters
|
||
Latest Splice Time in |
Displays the time remaining until the next splicing operation. |
||
line |
The line selected in the Lines window for which the splice prediction data is displayed |
||
Line Group |
Name of the group to which a line belongs
|