Station error
The following reports are available:
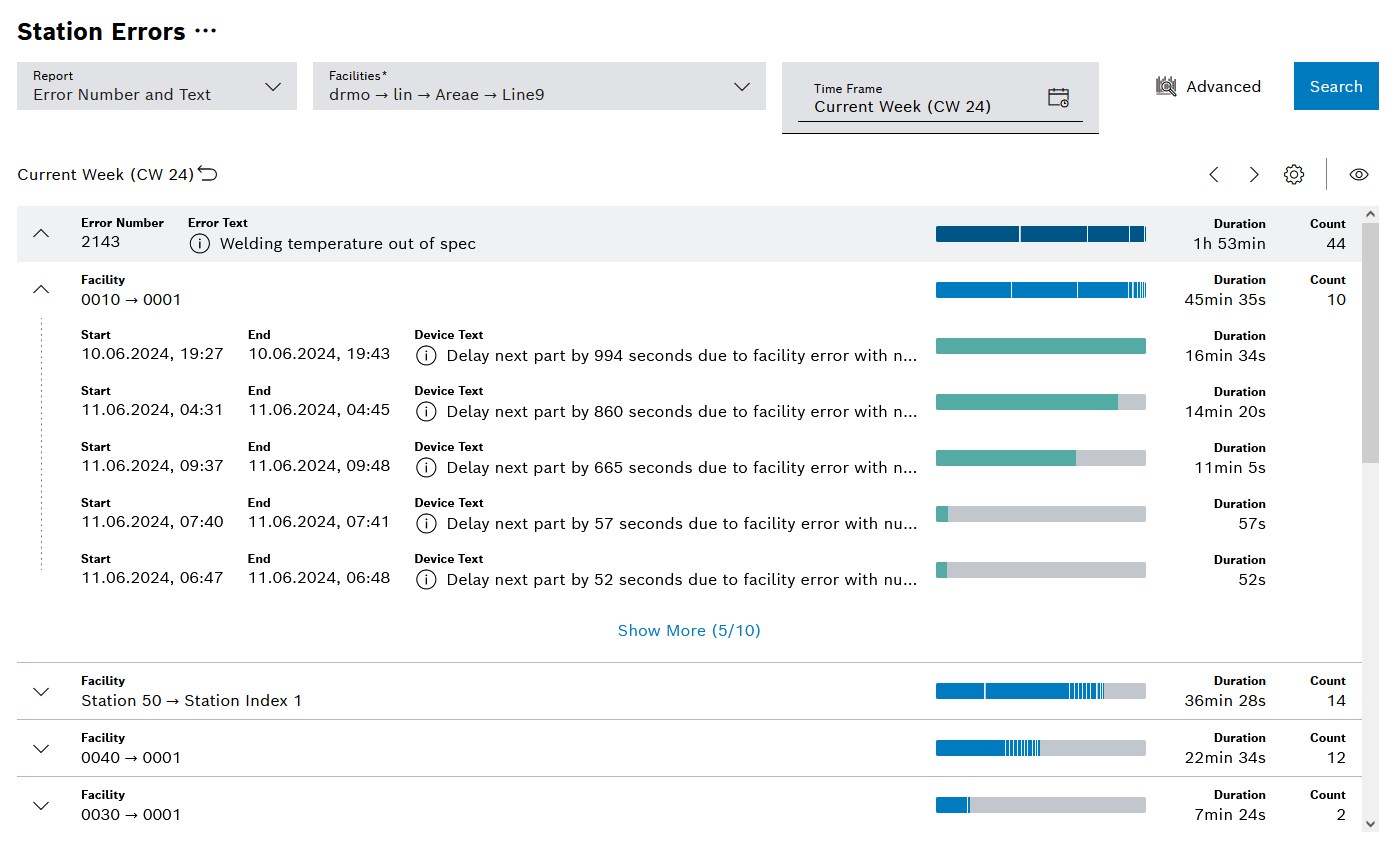
Error Numbers and Pareto Text
The Error Numbers and Pareto Text report shows station errors in the form of a Pareto chart.
| Element/icon | Description | ||
|---|---|---|---|
Error Number |
ID of the station error that occurred |
||
Error Text |
Error text that was configured for this station error |
||
|
Displays more details about the station error
|
||
Duration/MTTR (bar) |
Average downtime, i.e. total downtime divided by the number of downtimes in the form of a bar |
||
Duration/MTTR |
Average downtime, i.e. total downtime divided by the number of downtimes |
||
Count |
Number of station errors that occurred |
||
Facility |
Facility at which this station error occurred. |
||
Device Text |
Optional, additional device error text for a station error |

Diagram options
| Element | Description | ||
|---|---|---|---|
Display |
Selection between Durations with overlaps and Summarized durations
|
||
Duration |
Display as a total or MTTR
|
||
Number of Rows |
Number of rows added by clicking Show More. |
|
The bar chart scales separately at each level (different colors) |
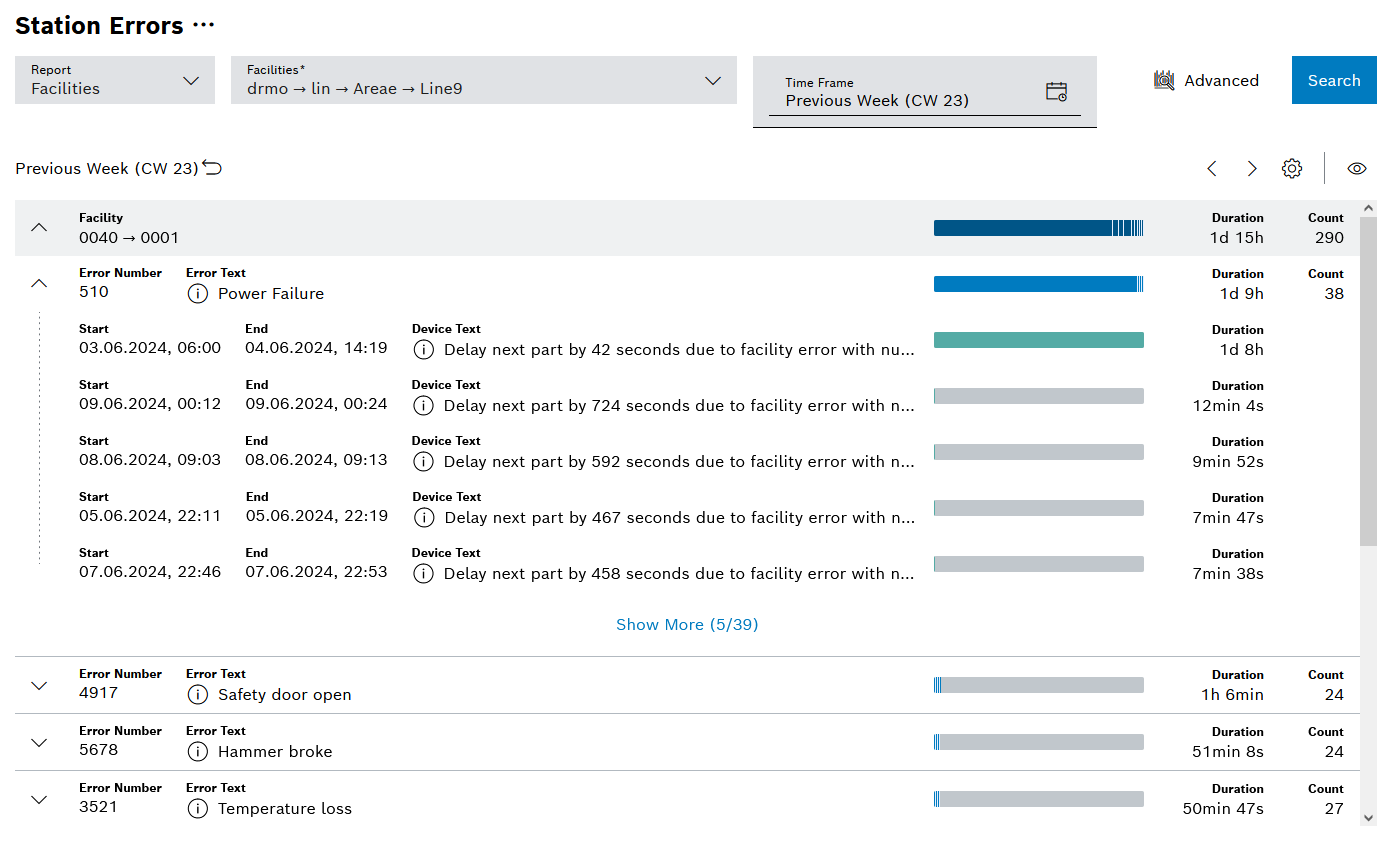
Facilities Pareto
The Facilities Pareto report shows station errors over facilities in the form of a Pareto chart.
| Element/icon | Description |
|---|---|
Facility |
Facility at which this station error occurred. |
Error Number |
ID of the station error that occurred |
Error Text |
Error text that was configured for this station error |
|
Displays more details about the station error |
Duration/MTTR (bar) |
Average downtime, i.e. total downtime divided by the number of downtimes in the form of a bar |
Duration/MTTR |
Average downtime, i.e. total downtime divided by the number of downtimes |
Count |
Number of station errors that occurred |
Device Text |
Optional, additional device error text for a station error |
Diagram options
| Element | Description | ||
|---|---|---|---|
Display |
Selection between Durations with overlaps and Summarized durations
|
||
Duration |
Display as a total or MTTR
|
||
Number of Rows |
Number of rows added by clicking Show More. |
|
The bar chart scales separately at each level (different colors) |
Station errors by time
The Station errors by time report shows an overview of the duration of station errors.
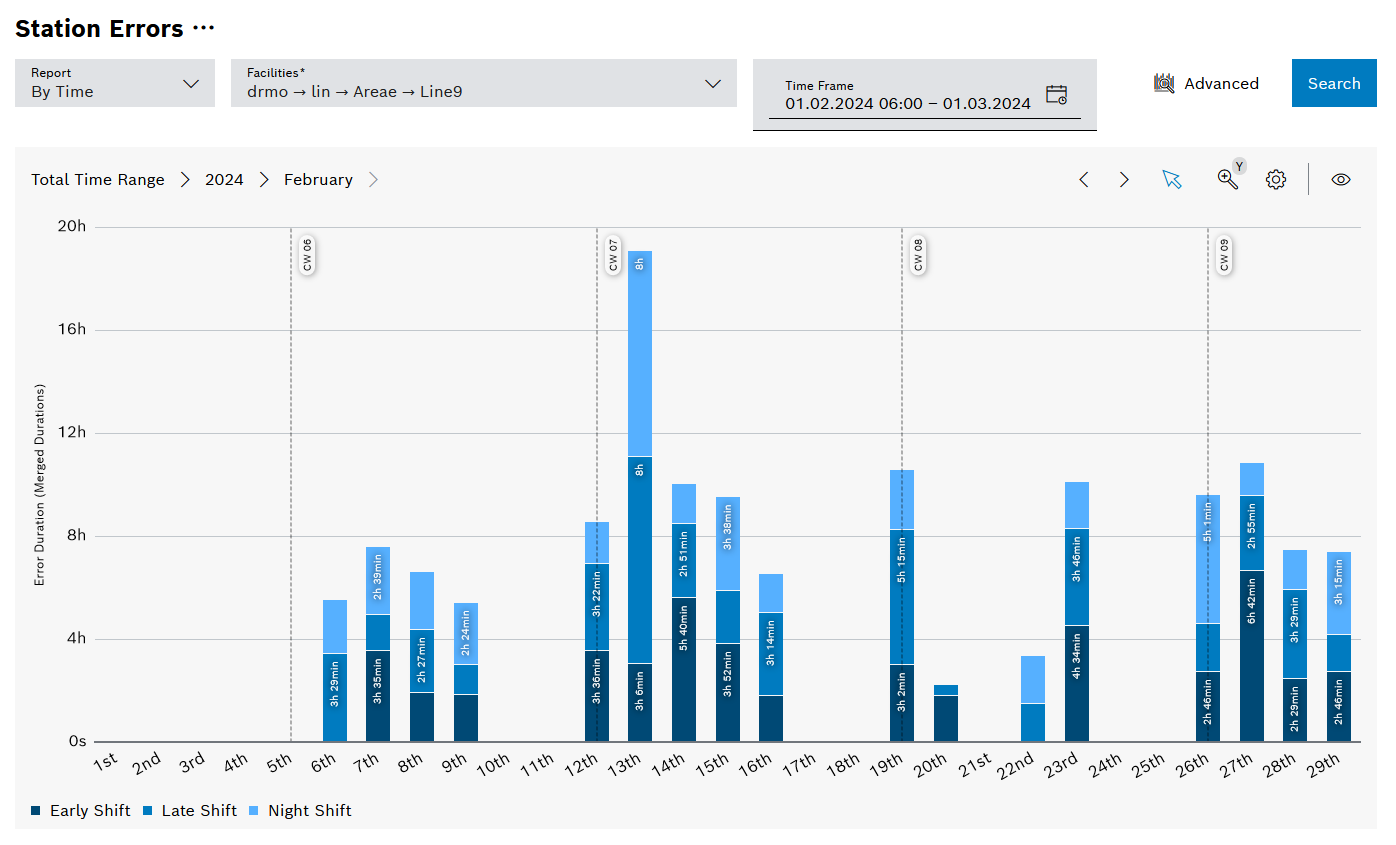
Legend
Click on the elements in the legend to show or hide them. Hidden elements are grayed out in the legend and the preceding icon is rotated.
| Element | Description |
|---|---|
Early Shift |
Displays the station errors that occurred during the early shift |
Late Shift |
Displays the station errors that occurred during the late shift |
Night Shift |
Displays the station errors that occurred during the night shift |
Diagram options
| Element | Description | ||
|---|---|---|---|
Display |
Selection between Durations with overlaps and Summarized durations
|
||
Duration |
Display as a total or MTTR.
|
||
Error Numbers |
Option to filter by Filter by error numbers of station errors that have occurred
|
