Nexeed
    • Introduction
    • User manual
      • Description of the Interaction Elements
        • Extended Search
        • Adjusting Diagram Zoom Level
        • Adjust display mode
      • General Key Figures tab
        • OEE
        • Utilization Rate
        • Productivity
      • Part Count tab
        • Part Count
        • Accumulated Part Count
        • Yield and Fall Off Rate
      • Interruptions tab
        • Station error
        • Downtimes
        • 4M Downtimes
      • Changeovers Tab
      • Cycle Times tab
        • Cycle Times
        • Cycle Time Trend
      • Equipment Analysis tab
        • Equipment State Distribution
        • Availability and Reliability
        • Facility events
    • API documentation
    • Glossary
KPI Reporting
  • Industrial Application System
  • Core Services
    • Block Management
    • Deviation Processor
    • ID Builder
    • Multitenant Access Control
    • Notification Service
    • Ticket Management
    • Web Portal
  • Shopfloor Management
    • Andon Live
    • Global Production Overview
    • KPI Reporting
    • Operational Routines
    • Shift Book
    • Shopfloor Management Administration
  • Product & Quality
    • Product Setup Management
    • Part Traceability
    • Process Quality
    • Setup Specs
  • Execution
    • Line Control
    • Material Management
    • Order Management
    • Packaging Control
    • Rework Control
  • Intralogistics
    • AGV Control Center
    • Stock Management
    • Transport Management
  • Machine & Equipment
    • Condition Monitoring
    • Device Portal
    • Maintenance Management
    • Tool Management
  • Enterprise & Shopfloor Integration
    • Archiving Bridge
    • Data Publisher
    • Direct Data Link
    • Engineering UI
    • ERP Connectivity
    • Gateway
    • Information Router
    • Master Data Management
    • Orchestrator

Nexeed Learning Portal

  • KPI Reporting
  • User manual
  • General Key Figures tab
  • OEE

OEE

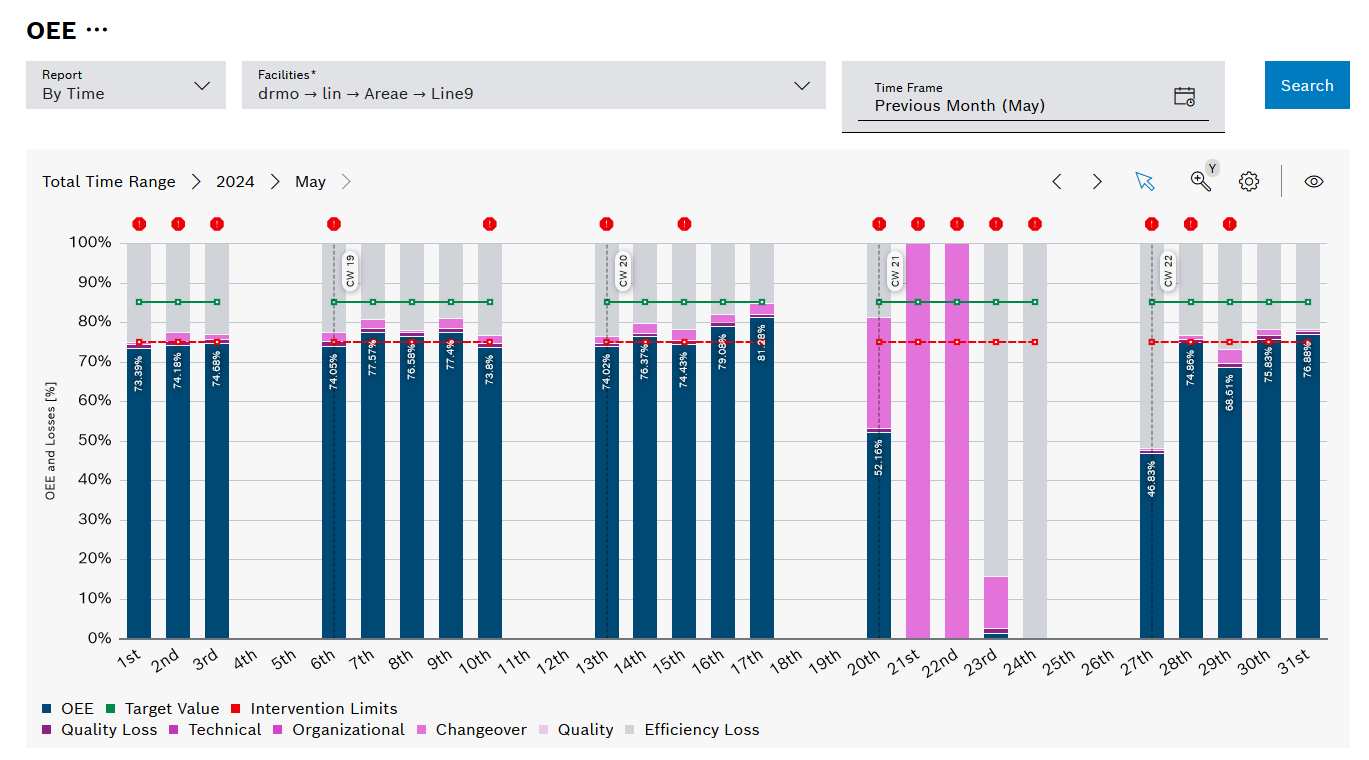
The OEE report shows OEE and losses across time and facility.

Ansicht Allgemein

Legend

Click on the elements in the legend to show or hide them. Hidden elements are grayed out in the legend and the preceding icon is rotated.

Element Description

OEE

Overall equipment effectiveness of one or more facilities

Target Value

OEE to be achieved

Intervention Limits

Validity range for the setpoint. Action is required if the upper intervention limit is exceeded or the lower intervention limit is undershot. If this is the case for the selected past period, alert-error-filled is displayed for this period.

Quality Loss

Part count losses, such as NOK parts, scrapped parts and rework.

Technical

Availability losses, for example due to a mechanical fault

Organizational

Availability losses, for example due to lack of workers

Changeover

Availability losses, for example due to changeover processes

Quality

Availability losses, for example due to defective additional components

Efficiency Loss

Remaining losses, for example due to minor faults or cycle time extension

Diagram options

Element/icon Description

Display format

Select between percentage or parts

Split Days Into Shifts

When activated, the OEE and losses per shift are displayed.

Only when selecting the Grouping by time report and only when grouping by day (e.g. one month as the time range).

High contrast

Displays the availability loss categories in high-contrast colors

Contents

© Robert Bosch Manufacturing Solutions GmbH 2023-2025, all rights reserved

Changelog Corporate information Legal notice Data protection notice Third party licenses