Nexeed
    • Introduction
    • User manual
      • Description of the Interaction Elements
        • Extended Search
        • Adjusting Diagram Zoom Level
        • Adjust display mode
      • General Key Figures tab
        • OEE
        • Utilization Rate
        • Productivity
      • Part Count tab
        • Part Count
        • Accumulated Part Count
        • Yield and Fall Off Rate
      • Interruptions tab
        • Station error
        • Downtimes
        • 4M Downtimes
      • Changeovers Tab
      • Cycle Times tab
        • Cycle Times
        • Cycle Time Trend
      • Equipment Analysis tab
        • Equipment State Distribution
        • Availability and Reliability
        • Facility events
    • API documentation
    • Glossary
KPI Reporting
  • Industrial Application System
  • Core Services
    • Block Management
    • Deviation Processor
    • ID Builder
    • Multitenant Access Control
    • Notification Service
    • Ticket Management
    • Web Portal
  • Shopfloor Management
    • Andon Live
    • Global Production Overview
    • KPI Reporting
    • Operational Routines
    • Shift Book
    • Shopfloor Management Administration
  • Product & Quality
    • Product Setup Management
    • Part Traceability
    • Process Quality
    • Setup Specs
  • Execution
    • Line Control
    • Material Management
    • Order Management
    • Packaging Control
    • Rework Control
  • Intralogistics
    • AGV Control Center
    • Stock Management
    • Transport Management
  • Machine & Equipment
    • Condition Monitoring
    • Device Portal
    • Maintenance Management
    • Tool Management
  • Enterprise & Shopfloor Integration
    • Archiving Bridge
    • Data Publisher
    • Direct Data Link
    • Engineering UI
    • ERP Connectivity
    • Gateway
    • Information Router
    • Master Data Management
    • Orchestrator

Nexeed Learning Portal

  • KPI Reporting
  • User manual
  • Equipment Analysis tab
  • Facility events

Facility events

The Facility events report shows an overview of the facility events for specific facilities in the selected time period.

The number of facility events displayed in the table view is limited to 2500. However, in a CSV export, all events are always exported.
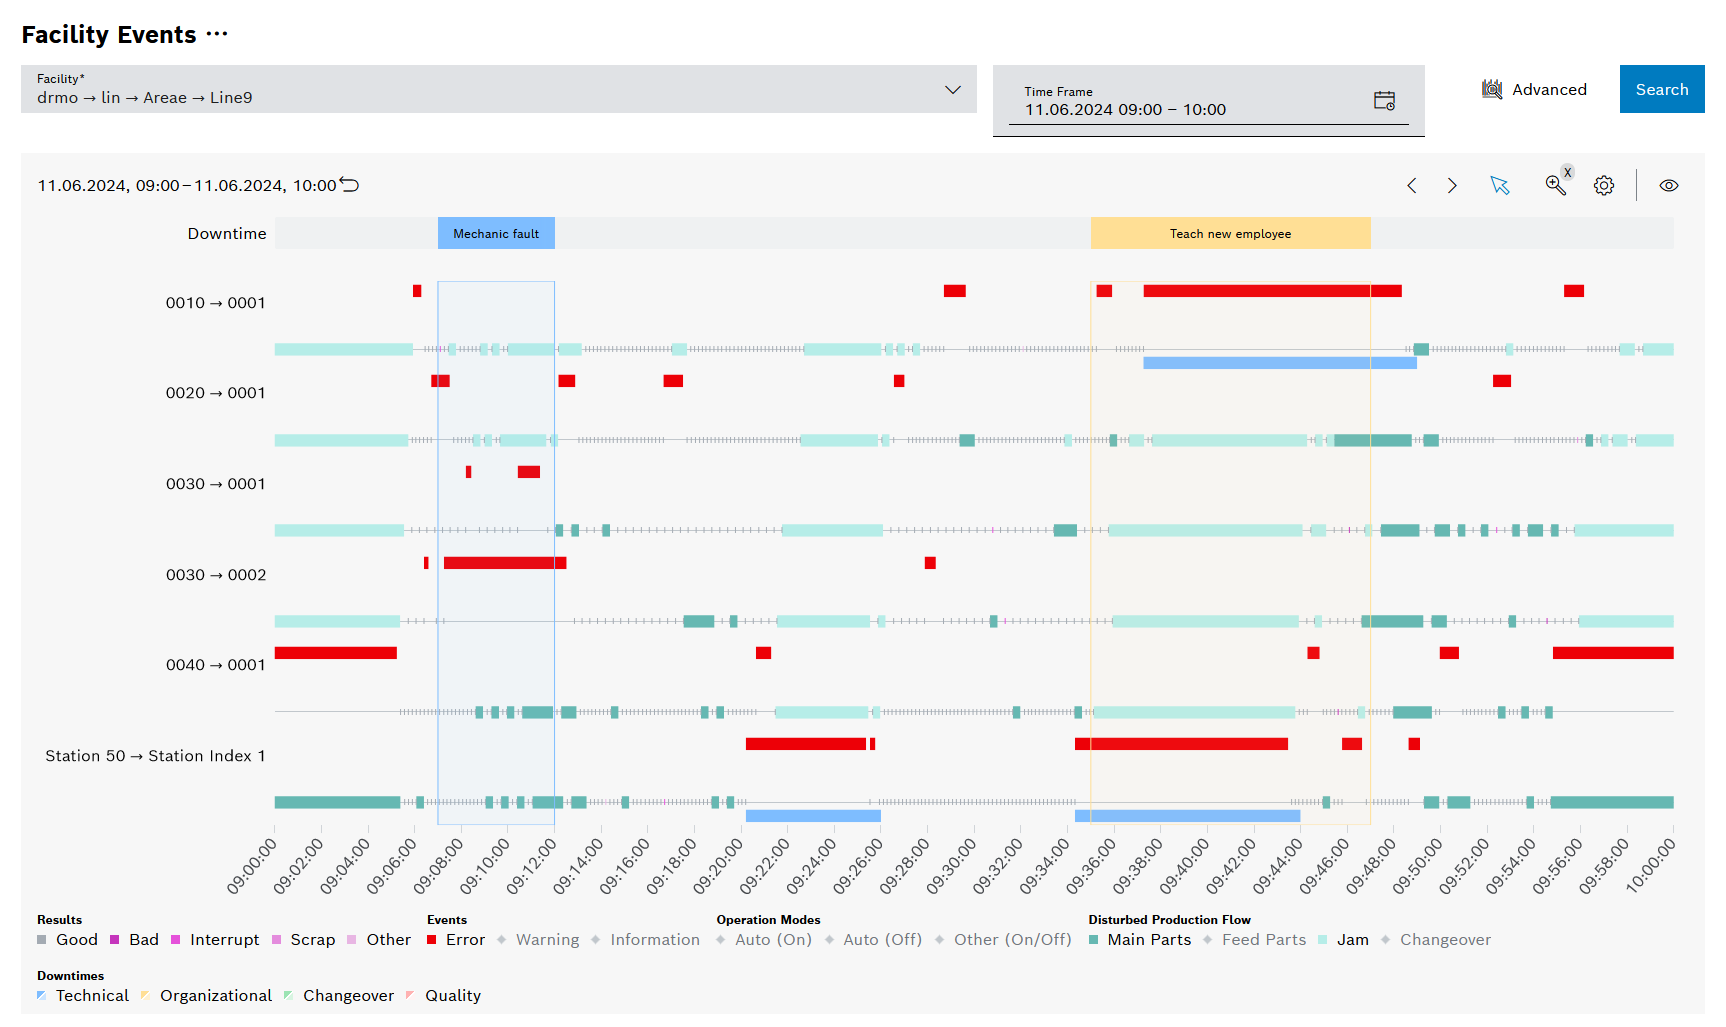
kpi_report_facilityevents_chart_2024_01_02

Legend

Click on the elements in the legend to show or hide them. Hidden elements are grayed out in the legend and the preceding icon is rotated.

Element Description

Results

Category of process results (good, poor, abort, scrap, other)

Events

Category of facility events (fault, warning, information)

Operating Modes

Displays the operating mode of the setup event, such as Auto (On), Auto (Off), and Other (On/Off)

Disrupted production flow

Shows the reason for the disrupted production flow (main parts, feed parts, bottleneck, setup)

Downtimes

Category of downtime (technical, organizational, changeover-related, quality)

Diagram options

Element Description

Display downtime markings

Projects line downtimes to all facilities starting from the top line

Downtime category

Selection of the displayed downtime categories
(technical, organizational, changeover, quality)

Downtime type

Display of only planned, only unplanned, or all downtimes

Planned downtimes are shown in gray, unplanned downtimes in the corresponding category color.

Contents

© Robert Bosch Manufacturing Solutions GmbH 2023-2025, all rights reserved

Changelog Corporate information Legal notice Data protection notice Third party licenses