Nexeed
    • Introduction
    • User manual
      • Description of the Interaction Elements
        • Extended Search
        • Adjusting Diagram Zoom Level
        • Adjust display mode
      • General Key Figures tab
        • OEE
        • Utilization Rate
        • Productivity
      • Part Count tab
        • Part Count
        • Accumulated Part Count
        • Yield and Fall Off Rate
      • Interruptions tab
        • Station error
        • Downtimes
        • 4M Downtimes
      • Changeovers Tab
      • Cycle Times tab
        • Cycle Times
        • Cycle Time Trend
      • Equipment Analysis tab
        • Equipment State Distribution
        • Availability and Reliability
        • Facility events
    • API documentation
    • Glossary
KPI Reporting
  • Industrial Application System
  • Core Services
    • Block Management
    • Deviation Processor
    • ID Builder
    • Multitenant Access Control
    • Notification Service
    • Ticket Management
    • Web Portal
  • Shopfloor Management
    • Andon Live
    • Global Production Overview
    • KPI Reporting
    • Operational Routines
    • Shift Book
    • Shopfloor Management Administration
  • Product & Quality
    • Product Setup Management
    • Part Traceability
    • Process Quality
    • Setup Specs
  • Execution
    • Line Control
    • Material Management
    • Order Management
    • Packaging Control
    • Rework Control
  • Intralogistics
    • AGV Control Center
    • Stock Management
    • Transport Management
  • Machine & Equipment
    • Condition Monitoring
    • Device Portal
    • Maintenance Management
    • Tool Management
  • Enterprise & Shopfloor Integration
    • Archiving Bridge
    • Data Publisher
    • Direct Data Link
    • Engineering UI
    • ERP Connectivity
    • Gateway
    • Information Router
    • Master Data Management
    • Orchestrator

Nexeed Learning Portal

  • KPI Reporting
  • User manual
  • Cycle Times tab
  • Cycle Time Trend

Cycle Time Trend

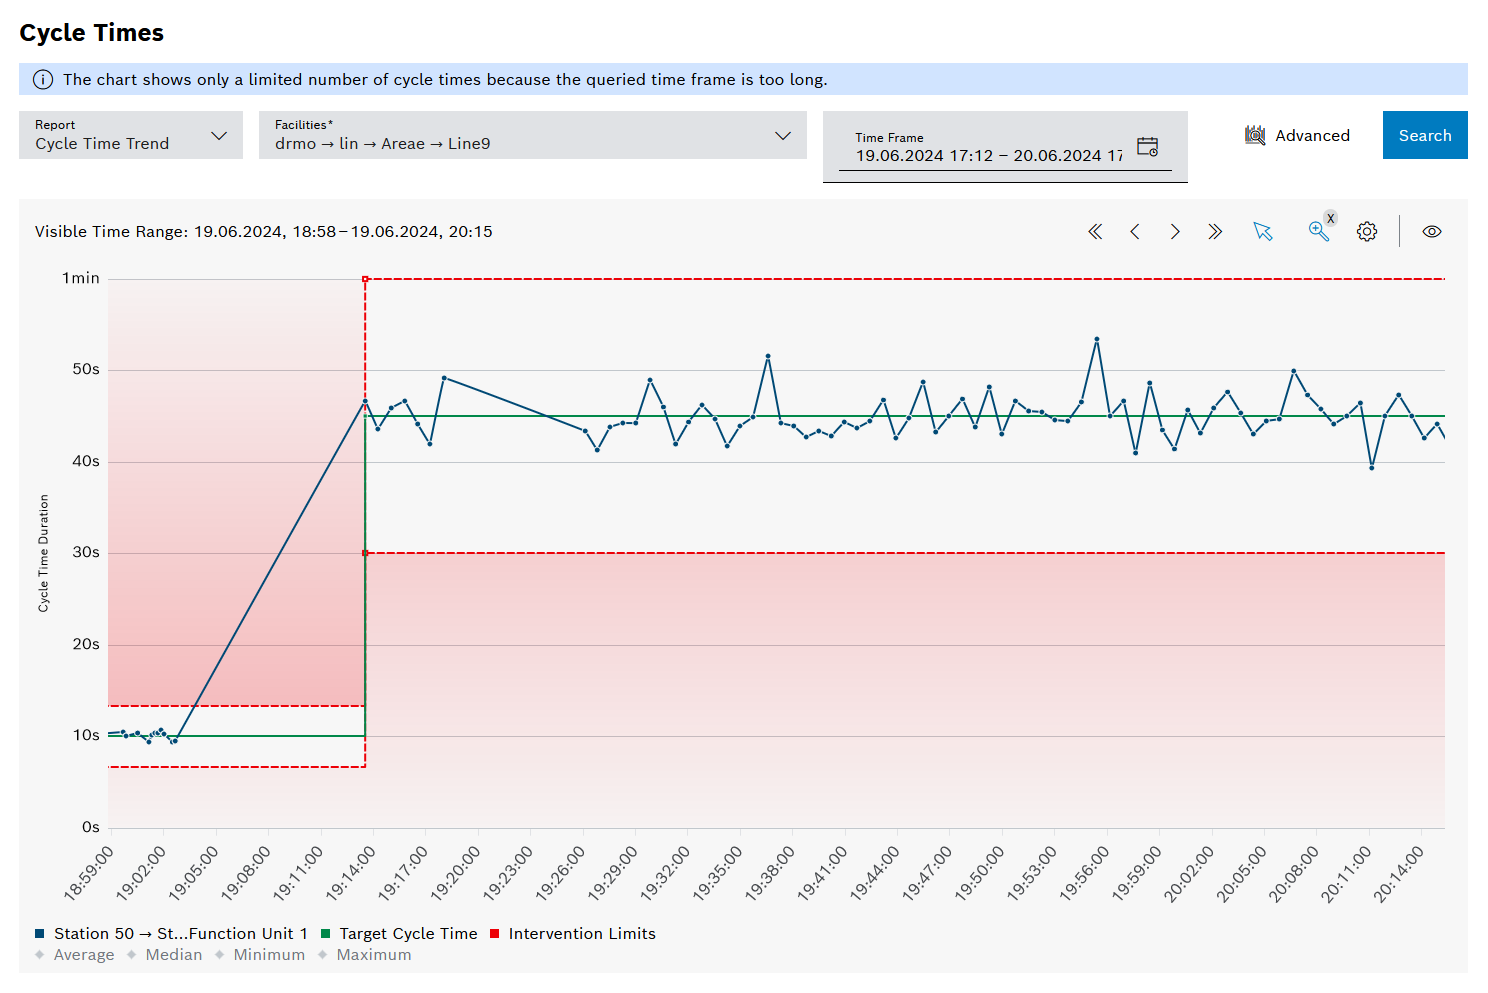
The Cycle Time Trend report displays the cycle times trend for a specific time period.

Ansicht Taktzeiten

Legend

Click on the elements in the legend to show or hide them. Hidden elements are grayed out in the legend and the preceding icon is rotated.

Element Description

Facility <xy>

Facility selected from the Facility(s) drop-down list

Target Cycle Time

The cycle time to be achieved

Intervention Limits

Validity range for the setpoint. Action is required if the upper intervention limit is exceeded or the lower intervention limit is undershot.

Average

Arithmetic mean value of the cycle times per type

Median

Median cycle time per type

Minimum

Minimum cycle time per type

Maximum

Maximum cycle time per type

Diagram options

Element Description

Counting Facility

The displayed target cycle time and the average, median, minimum and maximum values refer to this facility. Deactivated if only one counting facility is available.

Show Connecting Lines

When activated, the individual data points are connected to each other by lines.

Contents

© Robert Bosch Manufacturing Solutions GmbH 2023-2025, all rights reserved

Changelog Corporate information Legal notice Data protection notice Third party licenses