Description of the interaction elements
The following interaction elements are available:
Prerequisite
KPI Reporting: User or KPI Reporting: Admin role
| Element | Description | ||||
|---|---|---|---|---|---|
|
Select a report from the drop-down list |
||||
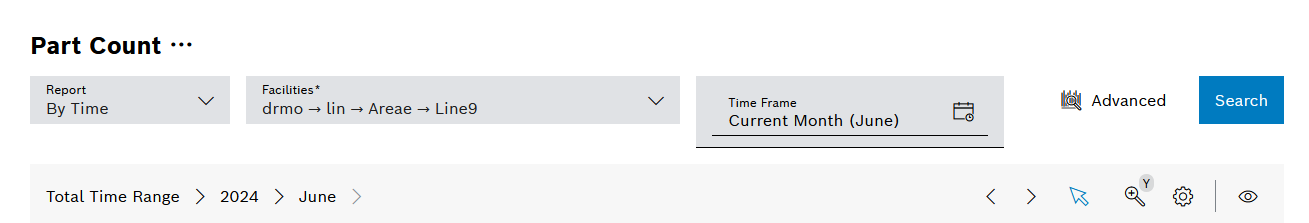
Report |
Select further reports, Pareto charts or the grouping from the drop-down list |
||||
Facility(s) |
Select one or more facilities for which a report is to be displayed from the drop-down list.
|
||||
|
Select the desired time range in the calendar |
||||
Refresh |
Refresh current view for new data or chanced options |
||||
|
|||||
|
|||||
|
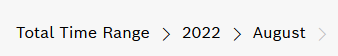
Adjust the time range in the breadcrumbs using or
|
||||
|
The calendar view changes to the previous or next day/month/year. |
||||
|
The tool tips displayed in a diagram can be shown or hidden.
|
||||
|
|||||
|
Different diagram options are available for the reports. These are described in the chapters of the respective reports. |
||||
|
|
||||
|
Show current report view in fullscreen mode. |
||||
CSV Export |
Exports the entries in the Table and Raw data display modes for further processing. |


|
The various report groups summarize the individual reports thematically. |
|
The availability of the Chart, Table and Raw data display modes is individual for each report. |