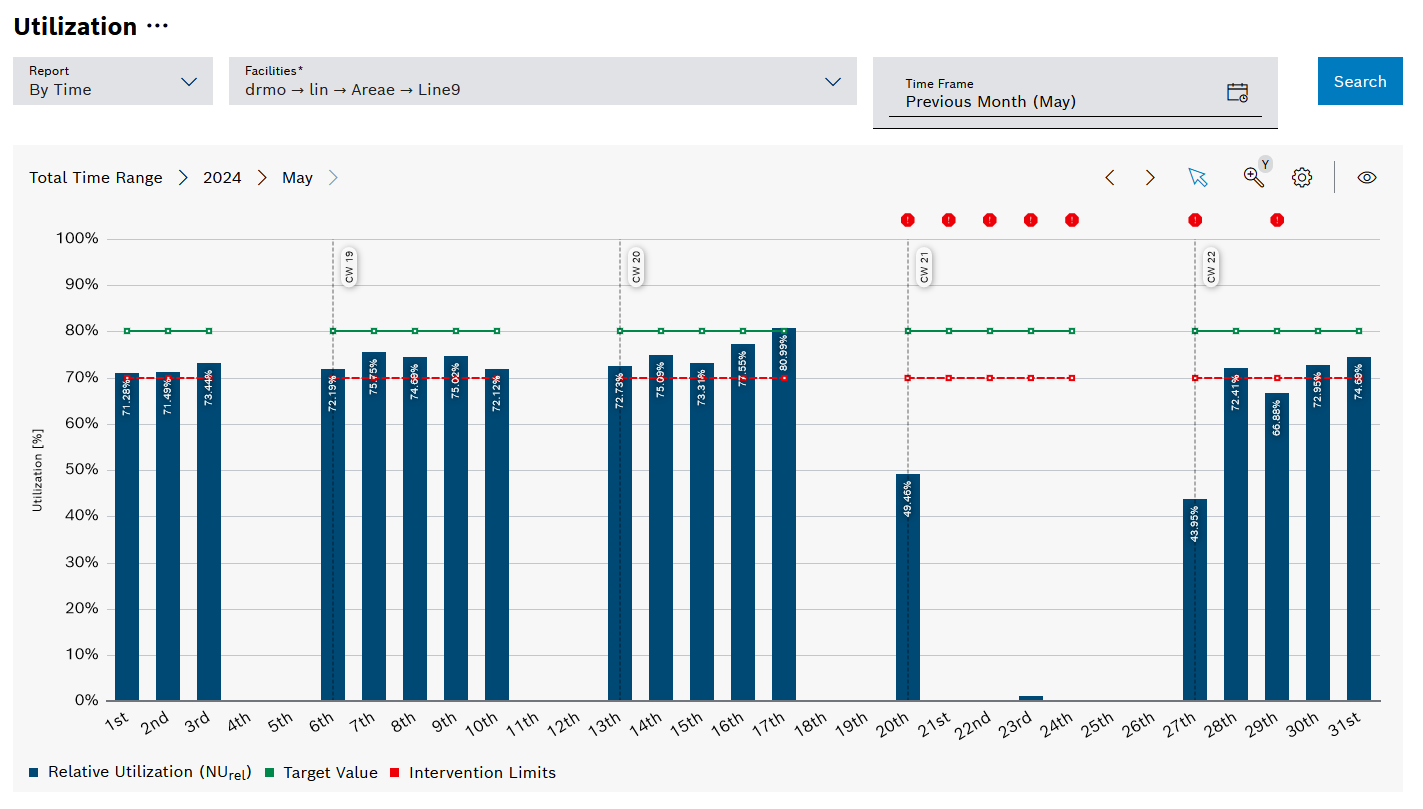
Nexeed
    • Introduction
    • User manual
      • Description of the Interaction Elements
        • Extended Search
        • Adjusting Diagram Zoom Level
        • Adjust display mode
      • General Key Figures tab
        • OEE
        • Utilization Rate
        • Productivity
      • Part Count tab
        • Part Count
        • Accumulated Part Count
        • Yield and Fall Off Rate
      • Interruptions tab
        • Station error
        • Downtimes
        • 4M Downtimes
      • Changeovers Tab
      • Cycle Times tab
        • Cycle Times
        • Cycle Time Trend
      • Equipment Analysis tab
        • Equipment State Distribution
        • Availability and Reliability
        • Facility events
    • API documentation
    • Glossary
KPI Reporting
  • Industrial Application System
  • Core Services
    • Block Management
    • Deviation Processor
    • ID Builder
    • Multitenant Access Control
    • Notification Service
    • Ticket Management
    • Web Portal
  • Shopfloor Management
    • Andon Live
    • Global Production Overview
    • KPI Reporting
    • Operational Routines
    • Shift Book
    • Shopfloor Management Administration
  • Product & Quality
    • Product Setup Management
    • Part Traceability
    • Process Quality
    • Setup Specs
  • Execution
    • Line Control
    • Material Management
    • Order Management
    • Packaging Control
    • Rework Control
  • Intralogistics
    • AGV Control Center
    • Stock Management
    • Transport Management
  • Machine & Equipment
    • Condition Monitoring
    • Device Portal
    • Maintenance Management
    • Tool Management
  • Enterprise & Shopfloor Integration
    • Archiving Bridge
    • Data Publisher
    • Direct Data Link
    • Engineering UI
    • ERP Connectivity
    • Gateway
    • Information Router
    • Master Data Management
    • Orchestrator

Nexeed Learning Portal

  • KPI Reporting
  • User manual
  • General Key Figures tab
  • Utilization Rate

Utilization Rate

The Utilization rate report shows the relative utilization rate, the actual utilization rate and the absolute utilization rate. The relative degree of utilization takes into account the planned downtimes only if the "Utilization rate (relative) relevant" property is set to false. The actual utilization rate does not take planned downtimes into account. The absolute utilization rate is based on an evaluation over 24 hours a day and 365 days a year.

kpi_report_general_utilization

Legend

Click on the elements in the legend to show or hide them. Hidden elements are grayed out in the legend and the preceding icon is rotated.

Element Description

Utilization Rate

Based on the Utilization rate diagram options.

Target Value

Utilization rate to be achieved

Intervention Limits

Validity range for the setpoint. Action is required if the upper intervention limit is exceeded or the lower intervention limit is undershot. If this is the case for the selected past period, alert-error-filled is displayed for this period.

Diagram options

Element Description

Utilization Rate

Relative (NU rel ): Based on the net shift time, which corresponds to the current time minus the planned downtimes, if the Utilization rate (relative) relevant property is set to False.

Actual (NU act ): Based on the gross shift time, which is equal to the absolute time minus the times without shifts.

Absolute (NU abs ): Based on 24 hours a day, 365 days a year.

Split Days Into Shifts

When activated, OEE and losses per shift are displayed

Only when selecting the Grouping by time report.

Display

Selection between the topological chart and the Pareto chart

Only when selecting the Grouping by facility report.

Contents

© Robert Bosch Manufacturing Solutions GmbH 2023-2025, all rights reserved

Changelog Corporate information Legal notice Data protection notice Third party licenses