Cycle Times
The Cycle Times report shows the median cycle times over time, over facilities or as a Pareto chart for the selected time range. In this way, the facility with the longest cycle time can be determined.
Legend
Click on the elements in the legend to show or hide them. Hidden elements are grayed out in the legend and the preceding icon is rotated.
| Element | Description |
|---|---|
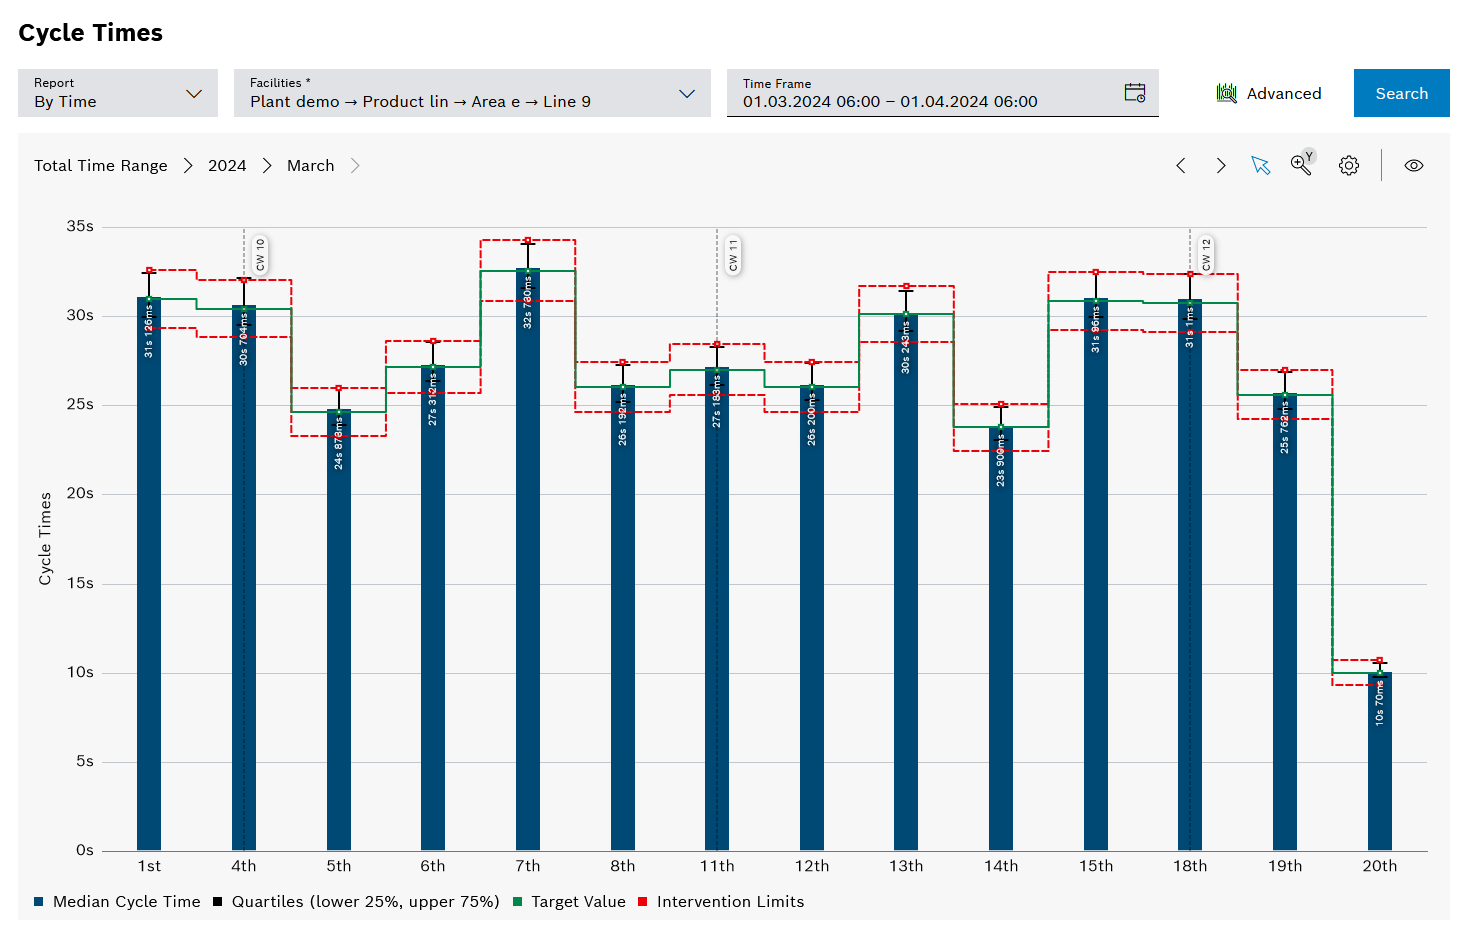
Median Cycle Time |
Median of the cycle time |
Quartiles (lower 25%, upper 75%) |
Shows the quartiles at 25% and 75% as black horizontal bars, connected by a vertical gray line |
Target Value |
Target cycle times to be achieved |
Intervention Limits |
Validity range for the setpoint. Action is required if the upper intervention limit is exceeded or the lower intervention limit is undershot. If this is the case for the selected past period or facility, |

Diagram options
| Element | Description | ||
|---|---|---|---|
Split Days Into Shifts |
When activated, displays the cycle times per shift
|
||
Display |
Selection between the topological chart and the Pareto chart
|
||
Pareto Display |
Select between sorting by median cycle time and interquartile distance
|