Extended search
Prerequisite
KPI Reporting: User or KPI Reporting: Admin role
Procedure
-
Click
 Advanced.
Additional search parameters are displayed depending on the report.
-
Define search parameters.
-
Click Search.
The view is filtered according to the search parameters.
Search parameter
|
The following search parameters depend on the selection of the report. |
-
To adjust the time frame manually:
Click
 and select a time frame as well as start and end dates.
 -
To filter by type groups/types:
Enter a type group or a type in Type Groups / Types.
To filter type groups and types, see Filter by type groups and types.
-
To adjust the facility aggregation level:
Select a facility aggregation level, such as Fu, Tp or Si, from the Facility Aggregation Level drop-down list.
-
To extend the end of the station error:
Activate the Extend Station Error End checkbox.
If the checkbox is activated, the duration of the station error is extended until the first part runs through the station again without errors.
-
To filter by error numbers:
Enter error number in Error Numbers.
To filter by error numbers, see Filter by error numbers.
-
To display pseudo errors:
Activate the Also Show Pseudo Errors checkbox.
Pseudo errors are consequential errors or errors defined in the event blocklist.
-
To filter by downtime causes:
Enter the downtime cause in Downtime Causes.
To filter by downtime causes, see Filter by downtime causes.
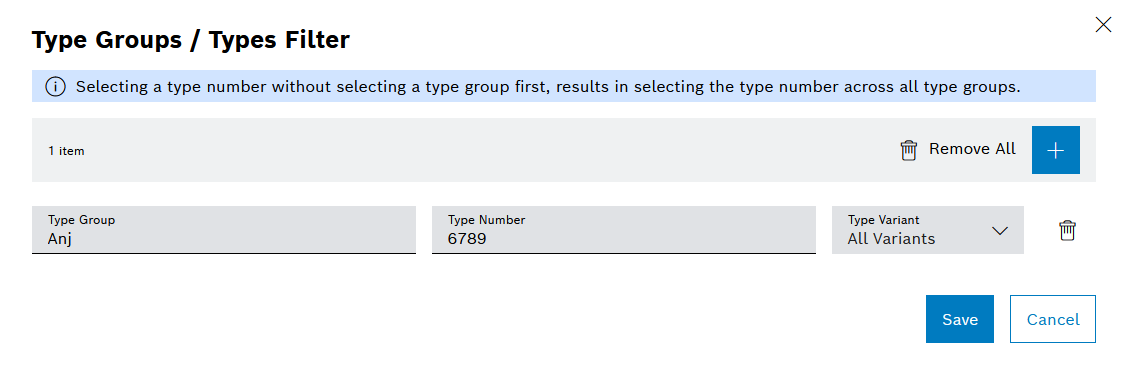
Filter by type groups and types
|
Filtering by type is only possible in the Quantity (not accumulated) reports. |
Types consist of type numbers that are subdivided into type groups. Optionally, types can also be assigned to a type variant. The combination of type and type variant may only occur once per type group. Higher-level target cycle times, and optionally target values as well, are defined in a type group.
-
Click
Advanced.Additional search parameters are displayed depending on the report.
-
Click
 .
.The Type Selection dialog opens:
-
Select Type group
After selecting a type group, only the types contained in this type group can be selected under Type number. It is not possible to select a type variant.
Or
Specify the Type number.
All types with this type number are listed hierarchically, sorted by type group.
A type variant can also be selected.
-
Click Save.
Search parameters are displayed in the Advanced dialog window.
| Element | Description |
|---|---|
|
Removes all entries. |
|
Adds a new type. |
Save |
Saves the information entered. The button can only be clicked if all information that has been entered is valid. |
Cancel |
Discards all changes. |


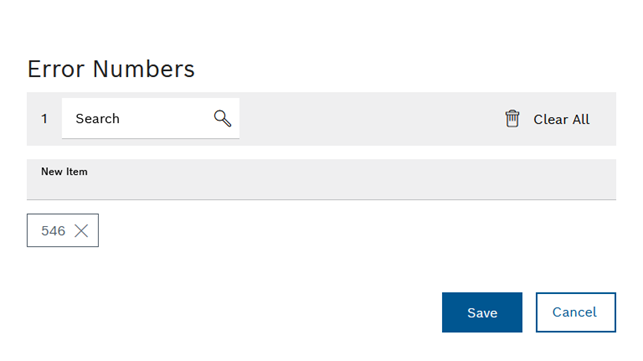
Filter by error numbers
|
Filtering by error number is only possible in the Station errors reports. |
Each station error has an error number. These error numbers are reported by the machine.
-
Click
Advanced.Additional search parameters are displayed depending on the report.
-
Enter error numbers in the Error numbers input field.
The Error Numbers dialog opens:
Alternatively, the Error numbers dialog can also be called up via
Edit in the Station errors diagram options. -
Enter an error number in New Item.
-
Confirm by pressing Enter.
The error number is added.
-
Click Save.
Search parameters are displayed in the Advanced dialog window.
| Element | Description |
|---|---|
Search |
|
|
Removes all entries. |
Save |
Saves the information entered. The button can only be clicked if all information that has been entered is valid. |
Cancel |
Discards all changes. |
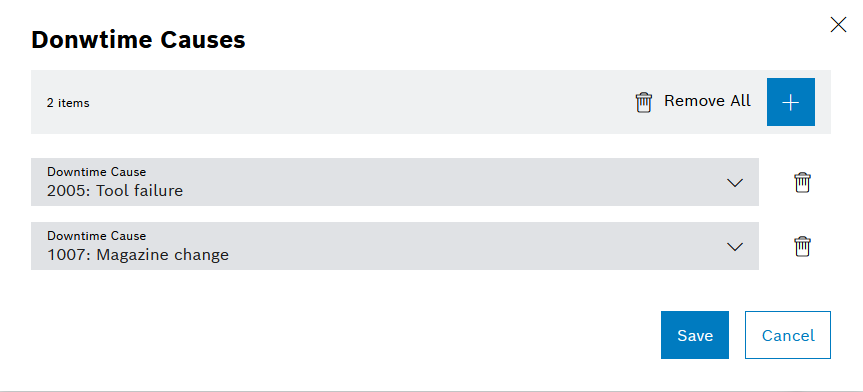
Filter by downtime causes
|
Filtering by downtime cause is only possible in the Downtime reports, except for 4M downtimes and Downtime causes with history |
Each downtime has a downtime cause, a start and end time, and a reference to a facility.
Downtime causes are categorized as follows:
-
Technical
Example: Mechanical fault in the system in the production line
-
Organizational
Example: Break
-
Changeover
Unplanned downtime cause for changing over to another type.
-
Quality
Unplanned downtime cause, e.g. due to defective additional components.
Procedure
-
Click
Advanced.Additional search parameters are displayed depending on the report.
-
Click
.The Downtime Causes dialog opens:
-
Enter the downtime cause in Downtime cause.
-
Confirm by pressing Enter.
The downtime cause is added.
-
Click Save.
Search parameters are displayed in the Advanced dialog window.
| Element | Description |
|---|---|
Search |
|
|
Removes all entries. |
Save |
Saves the information entered. The button can only be clicked if all information that has been entered is valid. |
Cancel |
Discards all changes. |