Nexeed
    • Introduction
    • User manual
      • Condition monitoring
        • Live tab
        • Counters tab
        • Measurements tab
        • Events tab
        • Rules tab
        • View configuration tab
        • Details tab
      • Rules management
        • Rule types/standard functions
        • Rule details page
      • Function configuration
      • Condition Monitoring Widgets
    • API documentation
      • Condition Monitoring HTTP API
      • Rules Management HTTP API
    • Glossary
Condition Monitoring
  • Industrial Application System
  • Core Services
    • Block Management
    • Deviation Processor
    • ID Builder
    • Multitenant Access Control
    • Notification Service
    • Ticket Management
    • Web Portal
  • Shopfloor Management
    • Andon Live
    • Global Production Overview
    • KPI Reporting
    • Operational Routines
    • Shift Book
    • Shopfloor Management Administration
  • Product & Quality
    • Product Setup Management
    • Part Traceability
    • Process Quality
    • Setup Specs
  • Execution
    • Line Control
    • Material Management
    • Order Management
    • Packaging Control
    • Rework Control
  • Intralogistics
    • AGV Control Center
    • Stock Management
    • Transport Management
  • Machine & Equipment
    • Condition Monitoring
    • Device Portal
    • Maintenance Management
    • Tool Management
  • Enterprise & Shopfloor Integration
    • Archiving Bridge
    • Data Publisher
    • Direct Data Link
    • Engineering UI
    • ERP Connectivity
    • Gateway
    • Information Router
    • Master Data Management
    • Orchestrator

Nexeed Learning Portal

  • Condition Monitoring
  • User manual
  • Condition monitoring

Condition monitoring

Under Performance analysis > Condition monitoring the main features of Condition Monitoring are located filtered by device.
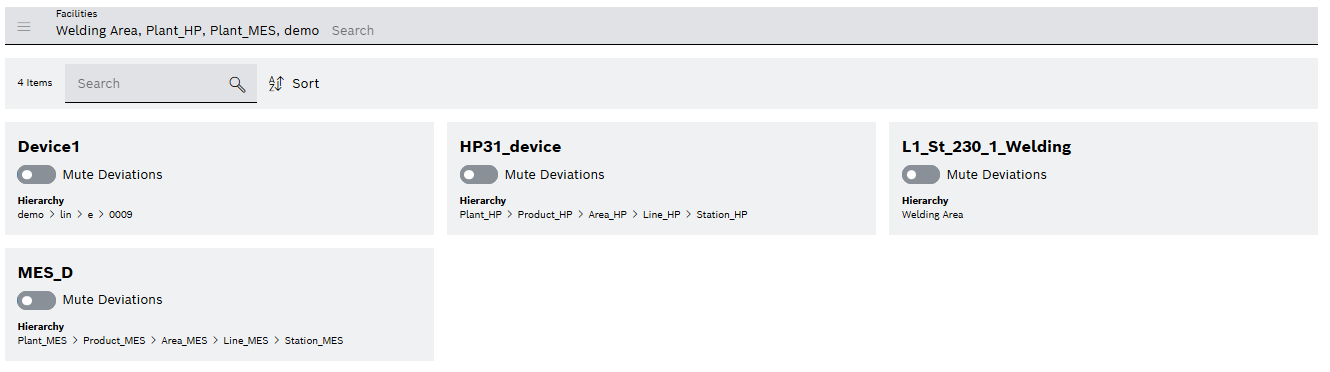
The Performance analysis > Condition monitoring menu has two areas: A list of selectable devices and the detailed view. On the device card, it is possible to mute the device, which means that no further deviation events are sent for this device. After a device is selected, the detailed view opens. The detailed view contains several tabs with to visualise the live measured values, counters, measured values, events, rules and details of the device.

List of devices

cm_View_device
Element Description

Facilities search

Select hierarchy level.
All devices of the selected hierarchy level are displayed in the Kanban view.

Search search

Search for device.

Enter the name of the device in full or in part.

sort-alphabetically Sort

Sort devices alphabetically.
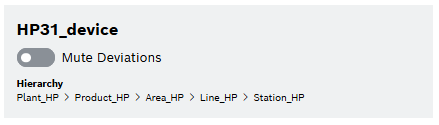
Details of a tile

cm_view_device_card
Element Description

Title

Name of the device

switch-unchecked

Mute Device (Disable sending of events)

Hierarchy level

Location of the device

Detailed view

The detailed view of the device contains the following tabs:

  • Live tab

    Show live measures of the device, including events and limit values

  • Counters tab

    Display defined counters of device and the possible reset

  • Measurements tab

    Analyse historic measures of the device, including events, limit values and part information

  • Events tab

    Display events based on machine messages and rule events

  • Rules tab

    Manage all rules of the selected device

    Rules can be also defined in general in Rules management main menu.
    Rules management

  • View configuration tab

    Configure individual views for live and measurements tab

  • Details tab

    View the details of the device

Contents

© Robert Bosch Manufacturing Solutions GmbH 2023-2025, all rights reserved

Changelog Corporate information Legal notice Data protection notice Third party licenses