Measurements
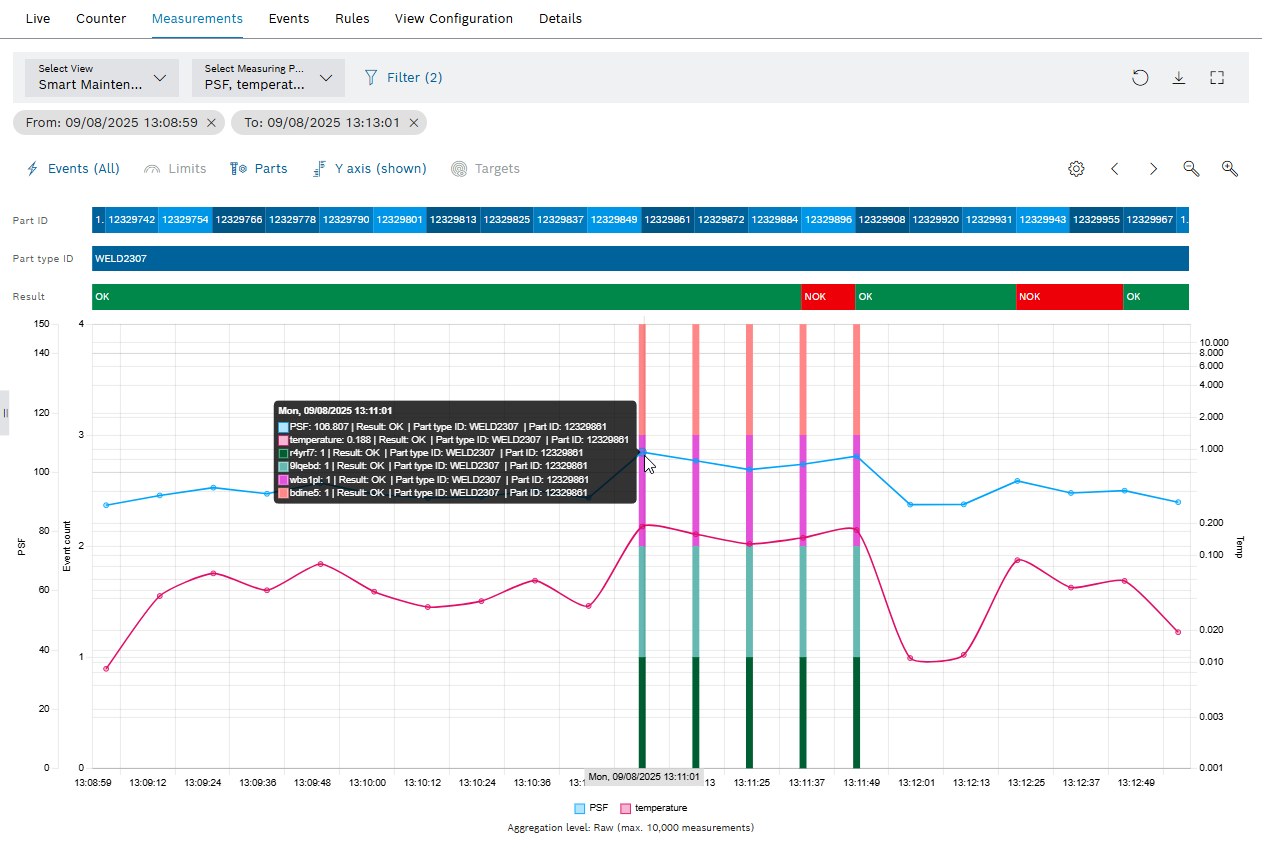
This device specific view, visualize detailed historic machine data, such as measured values, events, counters and limit values. These data are visualized in a customizable chart, with defined time period and aggregation level.
| Element | Description | ||
|---|---|---|---|
Select view |
Select a view from the drop-down list.
All measuring points This is the default view to display all measuring points of the device. |
||
Select Measuring Point |
Search and select the measuring points to be visualized in the chart.
|
||
|
Filter the chart by Time Range or limit displayed Events by Event Code. The selected time range stays also on switching to Events or Rules tab. Filters are persisted in the URL of the browser. This allows the user to share the current view with others. |
||
|
Reset all filters to defaults. |
||
|
Export measurements as CSV format, by selecting time range, and aggregation level. Export Measuring Points |
||
|
Open full-screen mode. The full-screen mode can be closed with [ESC]. |
||
|
Show and hide events. By clicking multiple times, it displays all events, only the events of the selected measuring point or no events at all. |
||
|
Show and hide limit values from the measured value messages.
|
||
|
Show and hide the Part ID , Part type ID and Result of the produced part on this device. |
||
|
Show and hide Y axes. |
||
|
Show and hide setpoint.
|
||
|
Configure Aggregation Settings of the View. Select Aggregation type and Aggregation Level. Configure aggregation settings |
||
|
Navigate forward or back the selected time range. |
||
|
Zoom in and out. This will select a smaller time window to be displayed in the chart.
|


Export Measuring Points
Measuring points can be exported for external analysis.
Prerequisite
Condition Monitoring User or Condition Monitoring Administrator role
Procedure
-
Call up the Performance analysis > Condition monitoring menu.
-
Select device.
-
Open the Measured Values tab.
The measuring points that are activated in the Select Measuring Point drop-down list are exported.
-
Activate measuring points from the Select Measuring Point drop-down list.
-
Open the export settings with
 .
.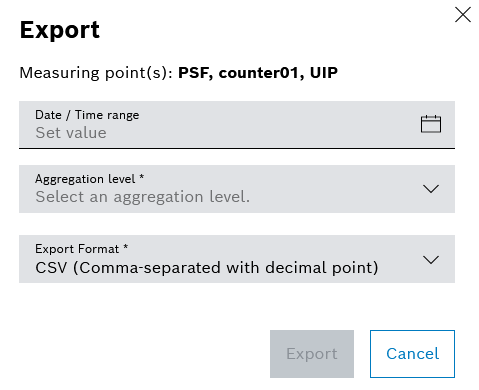
If a Date or Time Period is set in the filters of the Measured Values tab, the Date or Time Period is automatically entered in the Date/Time Period field.
-
Set the Date/Time Period.
-
Select the Aggregation level.
Limit values are only available in the Aggregation Level — Raw Data (Max. 10,000 Measured Values). Raw data is only displayed up to six hours in the past. If the maximum of 10,000 displayed measured values is reached, a warning message is issued. All other values are not included in the export.
-
Select Export Format.
-
Export measuring points with Export.
-
Select the directory, enter the file name and confirm with Save.
The measuring points are exported.
Configure aggregation settings
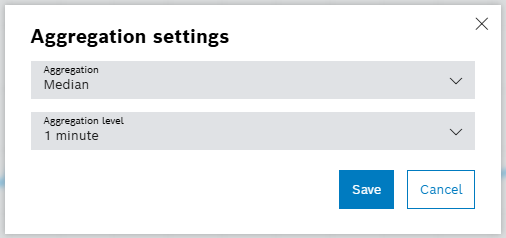
The aggregation settings are additional setting options in the Measured Values tab for identifying errors in the device. For example, outliers in the measured values can be displayed by means of the aggregation settings. The displayed time period can be limited by the filter function in the tab.
|
Limit values are only available in the Aggregation level — Raw data (max. 10,000 measured values). Raw data is only displayed up to six hours in the past. If the maximum of 10,000 displayed measured values is reached, a warning message is issued. |
Prerequisite
Condition Monitoring User or Condition Monitoring Administrator role
Procedure
-
Call up the Performance analysis > Condition monitoring menu.
-
Select device.
-
In the detailed view, open the Measured Values tab.
-
Select the time period using the filters with
 .
. -
Open the Aggregation settings with
 .
.
-
Select Aggregation.
Multiple aggregations can be selected to compare.
-
Count
Display all measured values in the specified time period.
-
Max
Display the largest measured values in the specified time period.
-
Mean
Display the average measured values in the specified time period.
-
Median
Display the median measured values in the specified time period.
-
Min
Display the smallest measured values in the specified time period.
-
-
Select the Aggregation level.
-
Automatic (one minute)
Display one measurement per minute in the specified time period.
-
Raw data (max. 10,000 measurement values)
Display raw data from the device within the specified time period.
-
Decimated Raw Data (Max. 10,000 Measurement Values)
Display only every second measurement of the raw data of the device in the specified time period.
-
One minute
Display one measurement per minute in the specified time period.
-
30 minutes
Display one measurement per 30 minutes in the specified time period.
-
1 hour
Display one measurement per hour in the specified time period.
-
12 hours
Display one measurement per 12 hours in the specified time period.
-
1 day
Display one measurement per 24 hours in the specified time period.
-
1 month
Display one measurement per 30 days in the specified time period.
-
-
Apply aggregation settings with Save.
The aggregation settings are applied to the Measured Values tab.