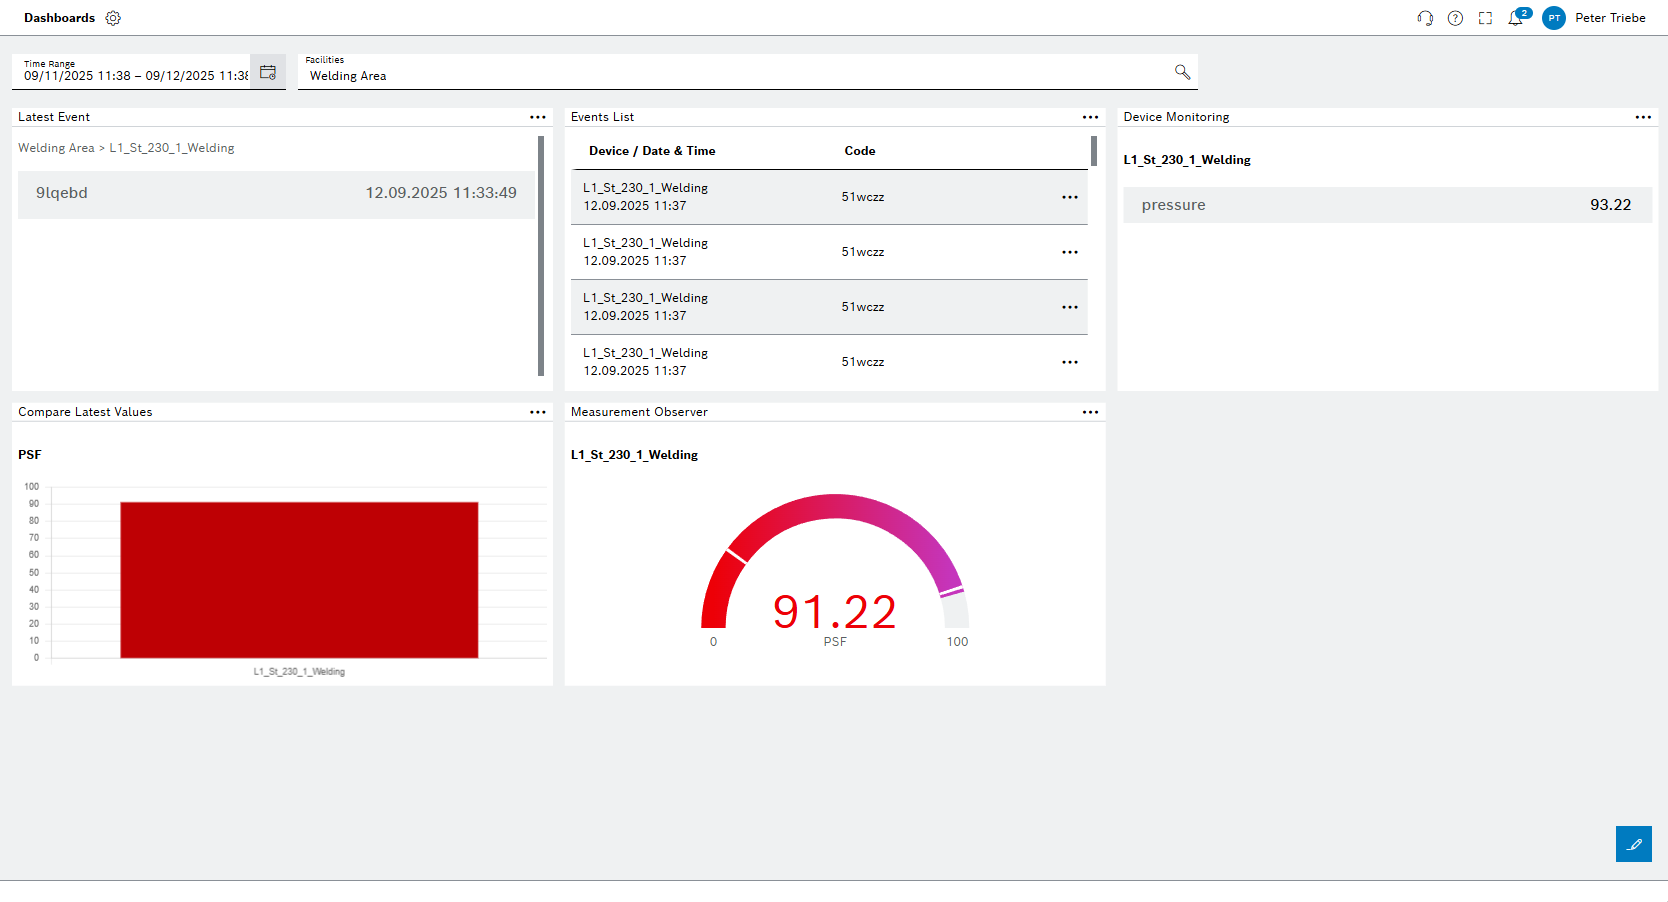
Condition Monitoring widgets
The Dashboards menu contains widgets that visualize relevant module data.
Widgets allow relevant module data to be displayed in a dashboard in compact form. This allows all important data to be monitored in a single overview.
See also: Widgets
Available for Condition Monitoring
Event widgets
-
Latest event
Displays the last event of a device.
-
List of events
Shows all current events in a list.
Measurement widgets
-
Device monitoring
Displays measured values, metadata and the status of a device.
-
Compare current values
Compares the most recent measured values from multiple devices.
-
Historical measurements
Displays historical measured values recorded over a selected time period.
-
Measuring point monitoring
Shows live data of a measuring point in a speedometer diagram.
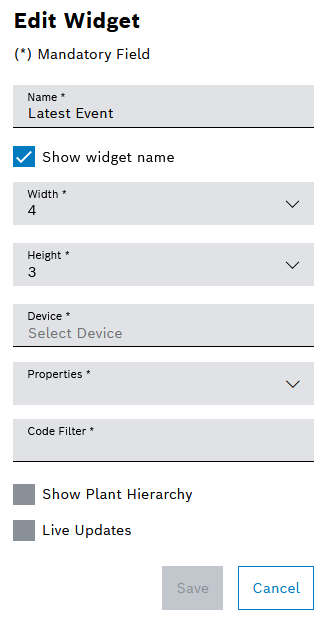
Configure "Latest Event" widget
Prerequisite
Condition Monitoring User or Condition Monitoring Administrator role
Procedure
-
Open the Dashboards menu.
-
Open the My Dashboard tab or the Dashboard tab.
-
Add Latest Event widget.
-
Configure the Name , Width , Height and Display of the Widget Name.
-
Configure specific parameters of the widget:
-
Select Device.
-
Select Property.
-
Select Code.
-
If the plant hierarchy is to be displayed, activate the Display Plant Hierarchy checkbox.
-
If the data is to be displayed live, activate the Live Update checkbox.
-
-
Confirm the entries with Save.
The widget is displayed with the entered data in the dashboard.
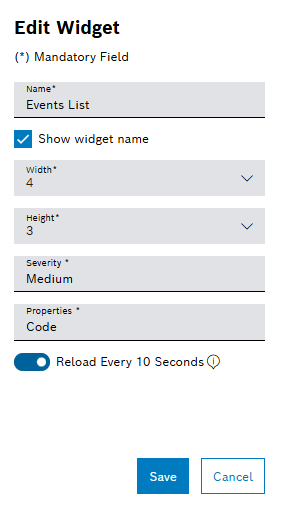
Configure "Event List" widget
Prerequisite
Condition Monitoring User or Condition Monitoring Administrator role
Procedure
-
Open the Dashboards menu.
-
Open the My Dashboard tab or the Dashboard tab.
-
Add Event List widget.
-
Configure the Name , Width , Height and Display of the Widget Name.
-
Configure specific parameters of the widget:
-
Select Severity.
-
Select Property displayed in the widget event list
-
If the data is to be updated every 10 seconds, activate the Update Every 10 Seconds checkbox.
-
-
Confirm the entries with Save.
The widget is displayed with the entered data in the dashboard.
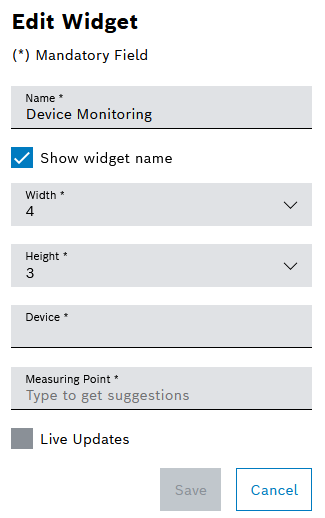
Configure "Device Monitoring" widget
Prerequisite
Condition Monitoring User or Condition Monitoring Administrator role
Procedure
-
Open the Dashboards menu.
-
Open the My Dashboard tab or the Dashboard tab.
-
Add Device Monitoring widget.
-
Configure the Name , Width , Height and Display of the Widget Name.
-
Select the device by entering the device name and selecting it from the Device drop-down list.
-
Select measuring point(s) by entering the name of the measuring point and selecting it from the Measuring Point drop-down list.
-
If the data is to be updated live, activate the Live Update checkbox.
-
Confirm the entries with Save.
The widget is displayed with the entered data in the dashboard.
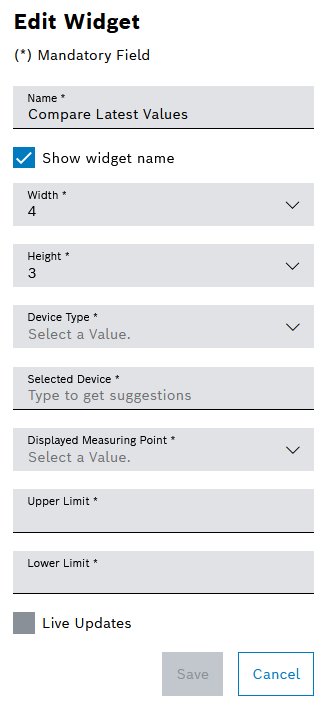
Configure "Compare Latest Values" widget
Prerequisite
Condition Monitoring User or Condition Monitoring Administrator role
Procedure
-
Open the Dashboards menu.
-
Open the My Dashboard tab or the Dashboard tab.
-
Add Compare Latest Values widget.
-
Configure the Name , Width , Height and Display of the Widget Name.
-
Select the device type by entering the name of the device type and selecting it from the Device Type drop-down list.
-
Select the device by entering the device name and selecting it from the Device drop-down list.
-
Select the measuring points by selecting the measuring point(s) from the Displayed Measuring Point drop-down list.
-
Define Limits by enter Upper Limit and Lower Limit
-
If the data is to be updated live, activate the Live Update checkbox.
-
Confirm the entries with Save.
The widget is displayed with the entered data in the dashboard.
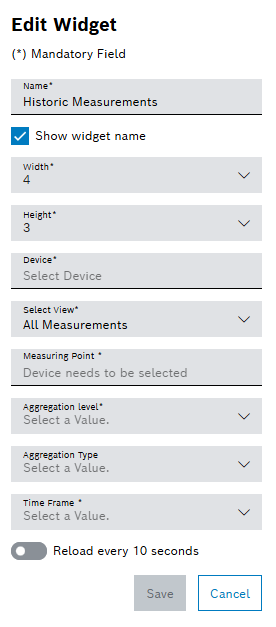
Configure "Historic Measurements" Widget
Prerequisite
Condition Monitoring User or Condition Monitoring Administrator role
Procedure
-
Open the Dashboards menu.
-
Open the My Dashboard tab or the Dashboard tab.
-
Add Historical Measurements widget.
-
Configure the Name , Width , Height and Display of the Widget Name.
-
Select the device by entering the device name and selecting it from the Device drop-down list.
-
Select view: In View Configuration Tab of Performance Analysis it is possible to define custom views. These views can also be used in this widget.
-
Available view depends on the selected device before.
-
After selecting a view, measuring points and aggregation settings will be preselected by the view configuration.
-
-
Select measuring points from the Measuring Points drop-down list. The available measuring points depending on the selected view before
-
Select Aggregation Level and Aggregation Type from the drop-down list. This is also prefilled by the selected view.
-
Select a Time Frame to define the range of measurements to display int the chart.
-
Activate the Update Every 10 Seconds toggle to keep the widget content up to date.
-
Confirm the entries with Save.
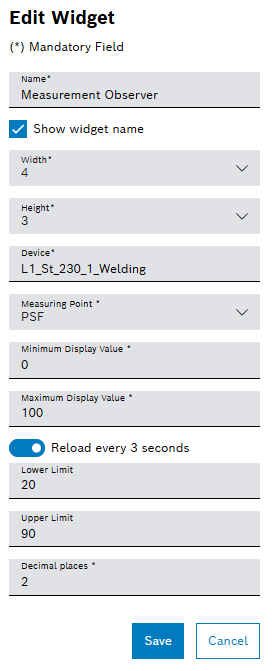
Configure "Measuring Observer" widget
Prerequisite
Condition Monitoring User or Condition Monitoring Administrator role
Procedure
-
Open the Dashboards menu.
-
Open the My Dashboard tab or the Dashboard tab.
-
Add Measuring Point Monitoring widget.
-
Configure the Name , Width , Height and Display of the Widget Name.
-
Choose a Device by entering the device name or select the device from the drop-down list.
-
Select one Measuring Point by from the drop-down list.
-
Enter the Smallest Displayed Value.
-
Enter the Largest Displayed Value.
-
To keep the Widget up to date, activate the Update Every 3 Seconds toggle.
-
Define Limits by enter Upper Limit and Lower Limit
-
Define the number of Decimal places visible in the widget.
-
Confirm the entries with Save.
The widget is displayed with the entered data in the dashboard.