Dashboards
Dashboards provide an overview of important data from licensed modules of the Nexeed Industrial Application System.
The dashboards contain widgets that visualize relevant module data.
To compile the data according to the target group, multiple dashboards with different widgets and configurations can be created.
-
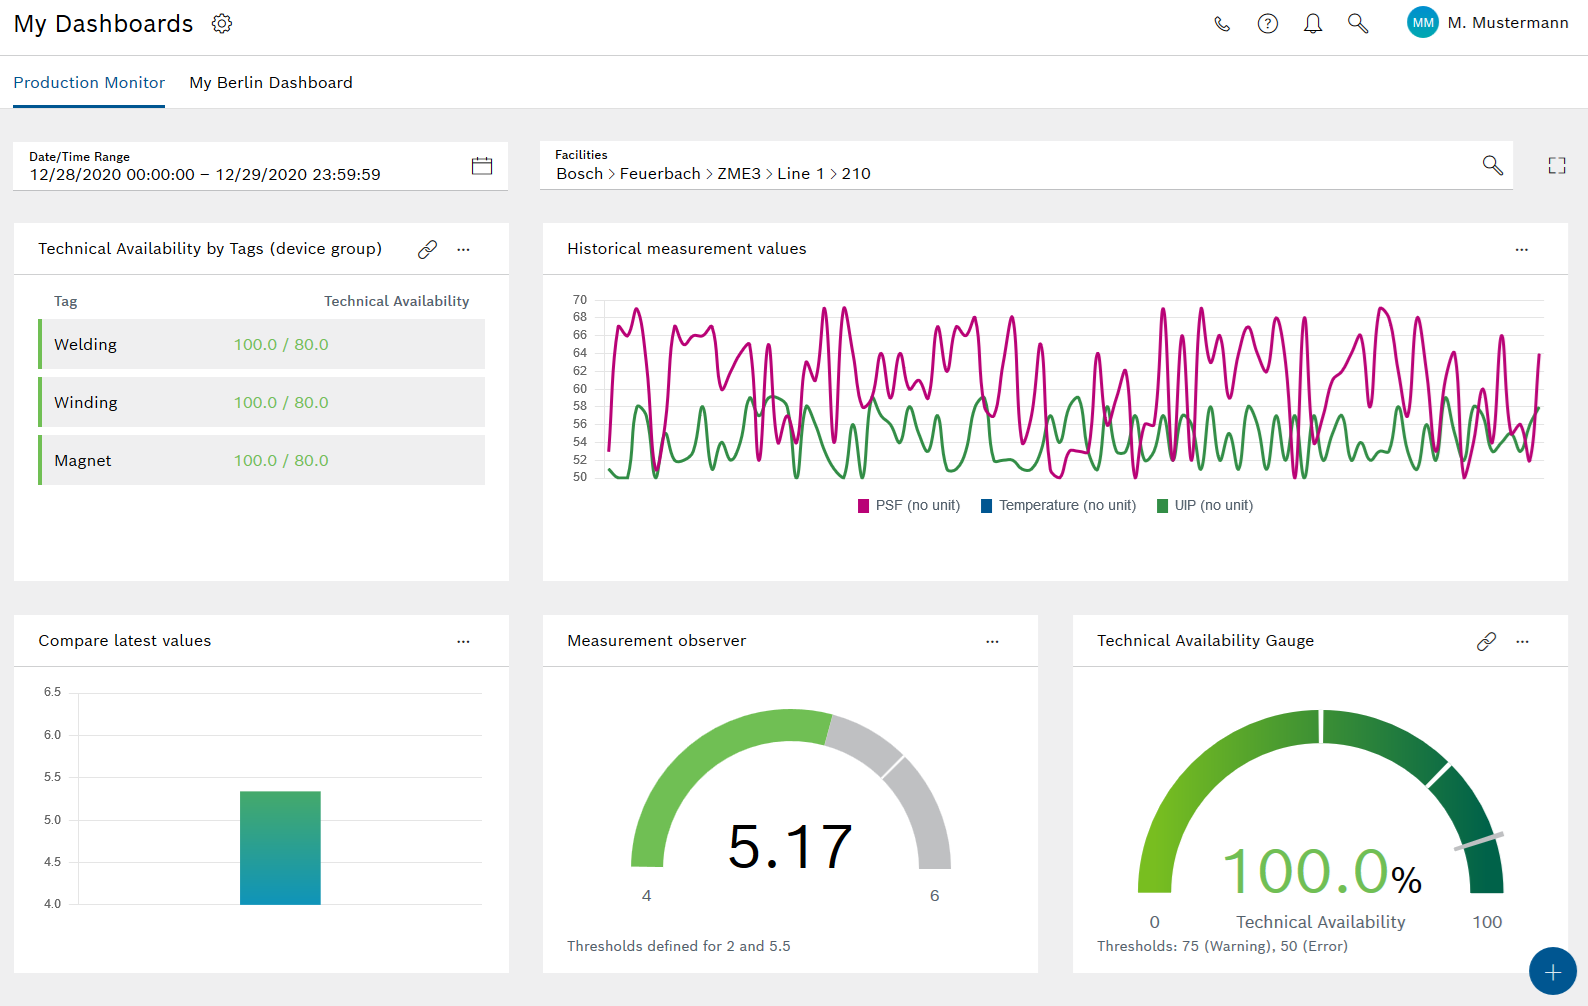
To open your own Dashboards in the menu, click Dashboards> My Dashboards.
Configure my dashboards
-
Click Dashboards > My dashboards in the main menu.
The dashboard appears.
-
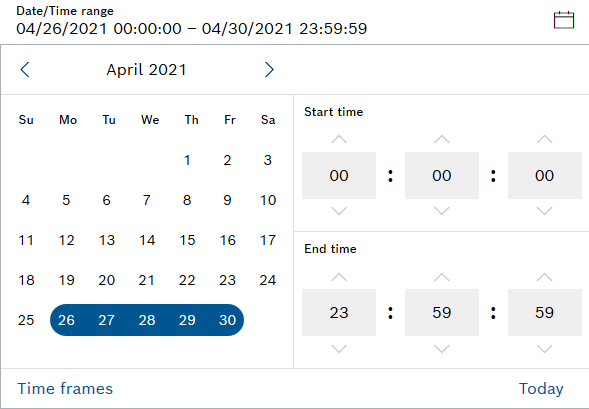
To adjust the reference period, click Date/time period.
The calendar is displayed.
The last 24 hours from the time of the login is set as the default time period. You cannot select a date in the future.
-
Click Time frame to select a predefined time period, for example Last hour , Last week , Last shift , or select the required Time period individually.
-
Click Today to select today’s date.
-
Click Save.
-
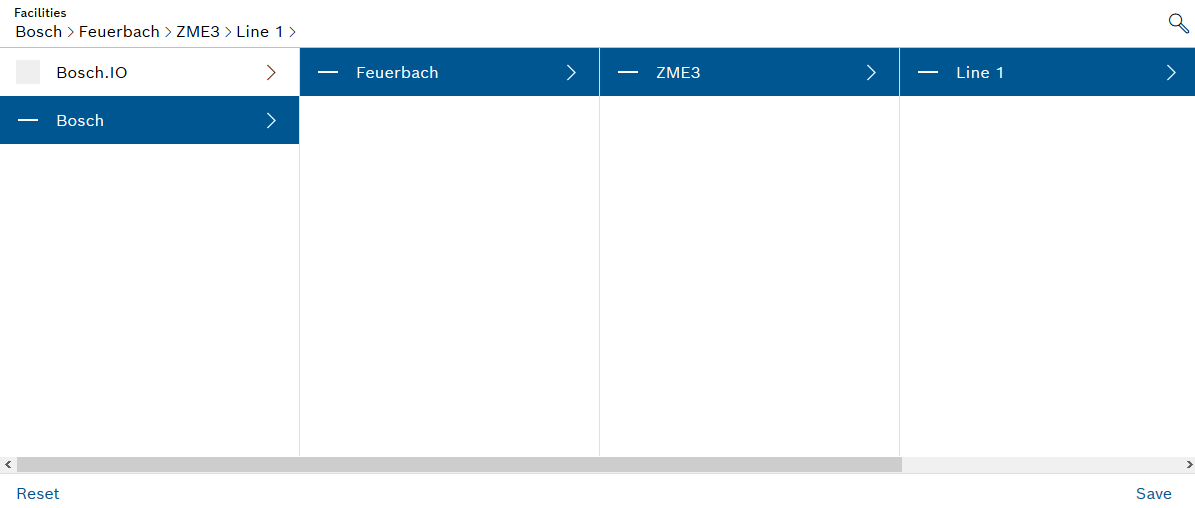
To select the equipment you wish to consider, click Equipment.
The dialog to select the equipment is displayed.
-
Select the required equipment.
-
To save the settings, click Save , or to reset the selection, click Reset.
The settings are applied.
-
To switch to full-screen mode, click
 ; to end full-screen mode, click
  .
. -
To add a widget, click
 Add widget.
The states of the devices, device types, etc. configured in the widgets are displayed for the selected period.
Add and edit dashboards
|
In the default configuration, the Web Portal has a dashboard. This is empty and does not contain any widgets. |
-
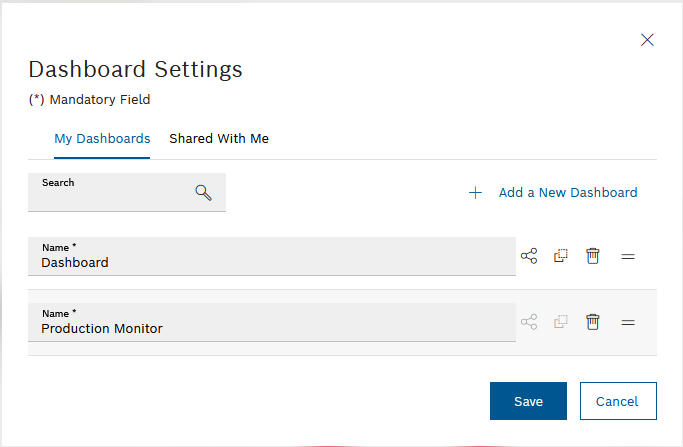
In the dashboard, click
 .
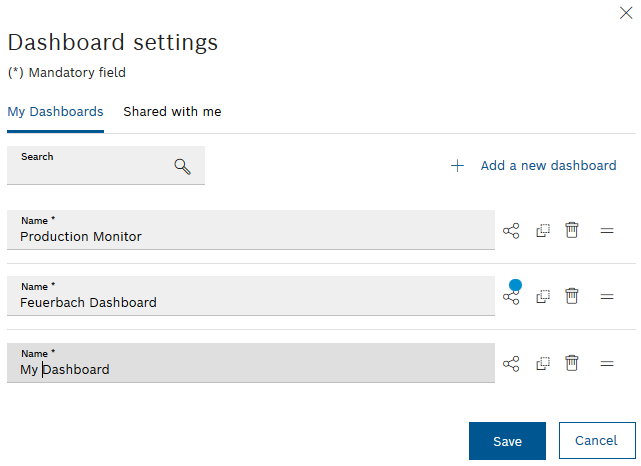
.The Dashboard settings dialog window appears.
-
To create a new dashboard, click
. -
To rename a dashboard, enter the new name in the input field.
-
To share a dashboard with all users or to stop sharing a dashboard, click
 :
:A shared dashboard is marked with a blue dot next to
. -
To create a copy of the dashboard, click
 .
. -
To delete a dashboard, click
 .
.A confirmation prompt is displayed.
-
To rearrange dashboards, press and hold
 and drag to the appropriate location.
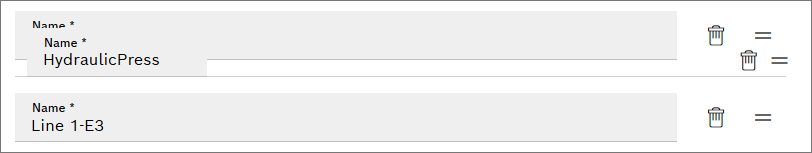
-
-
To accept the changes, click Save.
The dashboard appears on the main screen.
Sharing a dashboard
-
In the dashboard, click
.The Dashboard settings dialog window appears.
-
Click
in the row containing the dashboard that you wish to share. -
Select the permission ( Read or Edit ) in the Dashboard settings dialog.
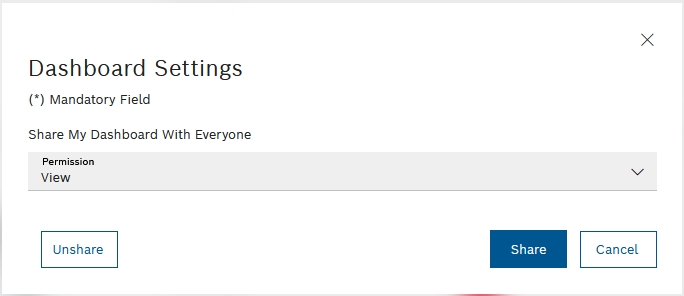
The Read permission does not enable other users to edit the shared dashboard.
-
The Edit permission must be selected to enable other users to edit the shared dashboard.
-
Click Share.
-
To finish sharing, click Stop Sharing.
The shared dashboard appears in the My dashboards area and is displayed in the Dashboard settings dialog window with the suffix Shared.
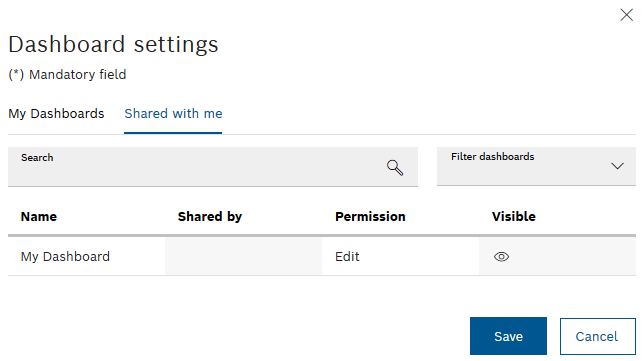
The shared dashboards appear on the Shared with me tab.
The dashboard is shared.
Manage shared dashboards
A split dashboard appears as a tab on the Dashboards > My Dashboards menu.
-
In the dashboard, click
.The Dashboard settings dialog window appears.
-
To hide a shared dashboard, click
 on the Dashboards > My Dashboards tab.
A dashboard hidden on this tab no longer appears as a tab in the Dashboards > My dashboards menu, but still appears in the Dashboard settings dialog on the Shared with me tab with the
 icon in the column.
The shared dashboards appear on the Shared with me tab and can be shown again by clicking
so that they are displayed again on the My dashboards tab.
On the Shared with me tab, shared dashboards can be filtered by Editable and Visible using the Filter dashboards drop-down list. In addition, the dashboard results can be narrowed down further using the search tool.
The dashboards are displayed or hidden on the My Dashboards tab.