Nexeed
    • Introduction
    • User manual
      • Description of the interaction elements
        • Additional actions
        • Extended search
        • Adjusting diagram zoom level
        • Adjust display mode
      • General key figures reports
        • OEE
        • Utilization rate
        • Productivity
      • Part count reports
        • Part count and loss processes
        • Accumulated part count
        • Yield and fall off rate
      • Interruptions reports
        • Downtimes
        • Station error
        • 4M downtimes
      • Changeovers reports
      • Cycle times reports
        • Cycle times
        • Cycle time trend
      • Equipment analysis reports
        • Equipment state distribution
        • Availability and reliability
        • Facility events
    • Operations manual
    • API documentation
    • Glossary
KPI Reporting
  • Industrial Application System
  • Core Services
    • Block Management
    • Deviation Processor
    • ID Builder
    • Multitenant Access Control
    • Notification Service
    • Ticket Management
    • Web Portal
  • Shopfloor Management
    • Andon Live
    • Global Production Overview
    • KPI Reporting
    • Operational Routines
    • Shift Book
    • Shopfloor Management Administration
  • Product & Quality
    • Product Setup Management
    • Part Traceability
    • Process Quality
    • Setup Specs
  • Execution
    • Line Control
    • Material Management
    • Order Management
    • Packaging Control
    • Rework Control
  • Intralogistics
    • AGV Control Center
    • Stock Management
    • Transport Management
  • Machine & Equipment
    • Condition Monitoring
    • Device Portal
    • Maintenance Management
    • Tool Management
  • Enterprise & Shopfloor Integration
    • Archiving Bridge
    • Data Publisher
    • Direct Data Link
    • Engineering UI
    • ERP Connectivity
    • Gateway
    • Information Router
    • Master Data Management
    • Orchestrator

Nexeed Learning Portal

  • KPI Reporting
  • User manual
  • Interruptions reports

Interruptions reports

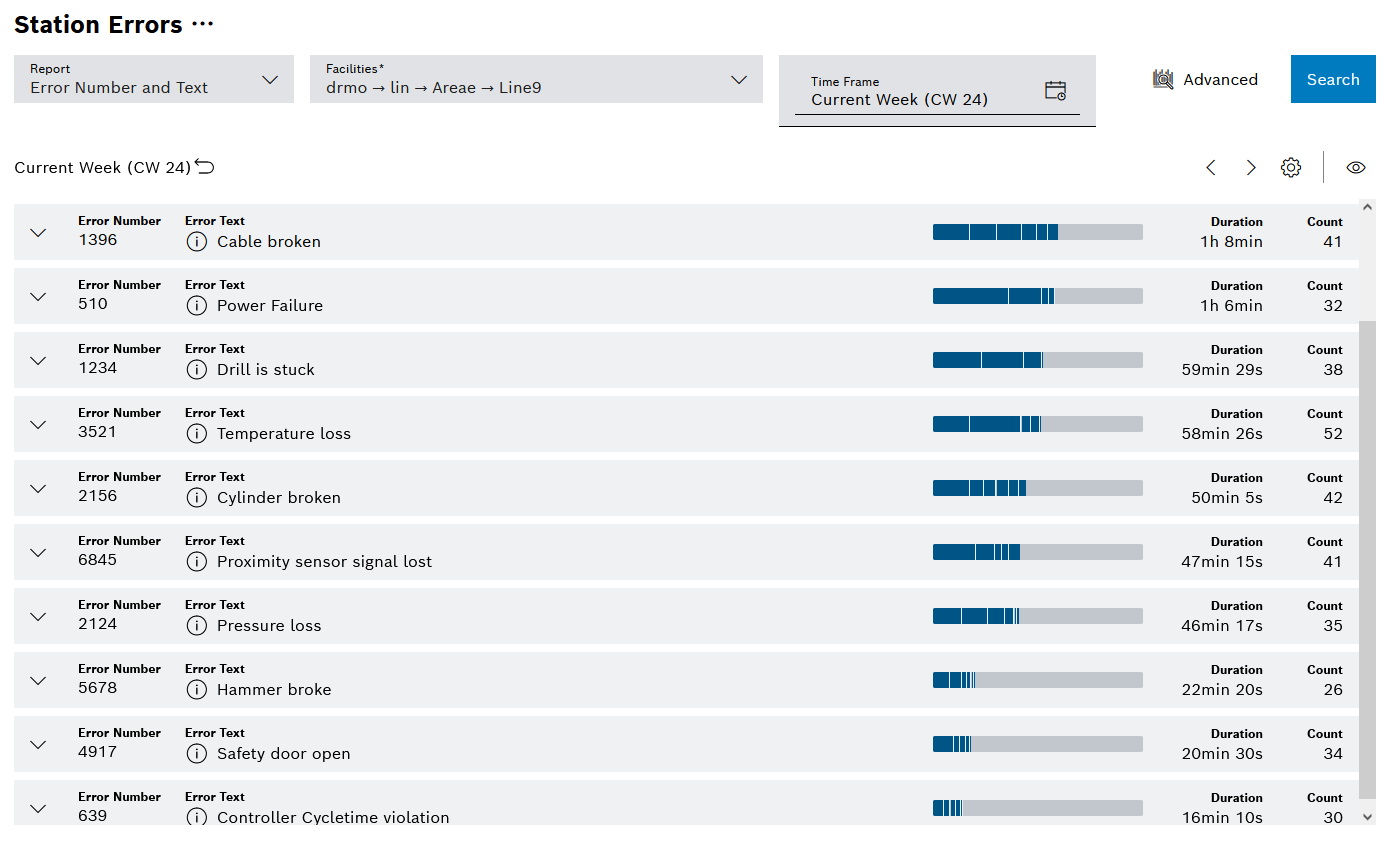
On the Interruptions tab, station errors and downtimes can be optionally displayed in the form of a Pareto chart or a list with 4M downtimes.

There are two Pareto charts each for the station errors and downtimes reports. In addition, both reports can be grouped by time.

Anzeige Unterbrechungen

Contents

© Robert Bosch Manufacturing Solutions GmbH 2023-2025, all rights reserved

Changelog Corporate information Legal notice Data protection notice Third party licenses