Cycle time trend
The Cycle Time Trend report displays the cycle times trend for a specific time period.
Legend
Click on the elements in the legend to show or hide them. Hidden elements are grayed out in the legend and the preceding icon is rotated.
| Element | Description |
|---|---|
Facility <xy> |
Counting facility(s) selected from the Facility(s) drop-down list |
Target Cycle Time |
The cycle time to be achieved |
Intervention Limits |
Validity range for the setpoint. Action is required if the upper intervention limit is exceeded or the lower intervention limit is undershot. |
Average |
Arithmetic mean value of the cycle times per type |
Median |
Median cycle time per type |
Minimum |
Minimum cycle time per type |
Maximum |
Maximum cycle time per type |
Diagram options
| Element | Description |
|---|---|
Cycle Time |
Selection between Delivery Cycle Time and Reference Cycle Time. |
Additional Equipment Events |
Specifies if any or which events may occur within a shown process cycle as Reference Cycle Time. All other cycles are being filtered out. Deactivated if Delivery Cycle Time is selected. |
Counting Facility |
The displayed target cycle time and the average, median, minimum and maximum values refer to this facility. Deactivated if only one counting facility is available. |
Show Connecting Lines |
When activated, the individual data points are connected to each other by lines. |
Type of cycle times
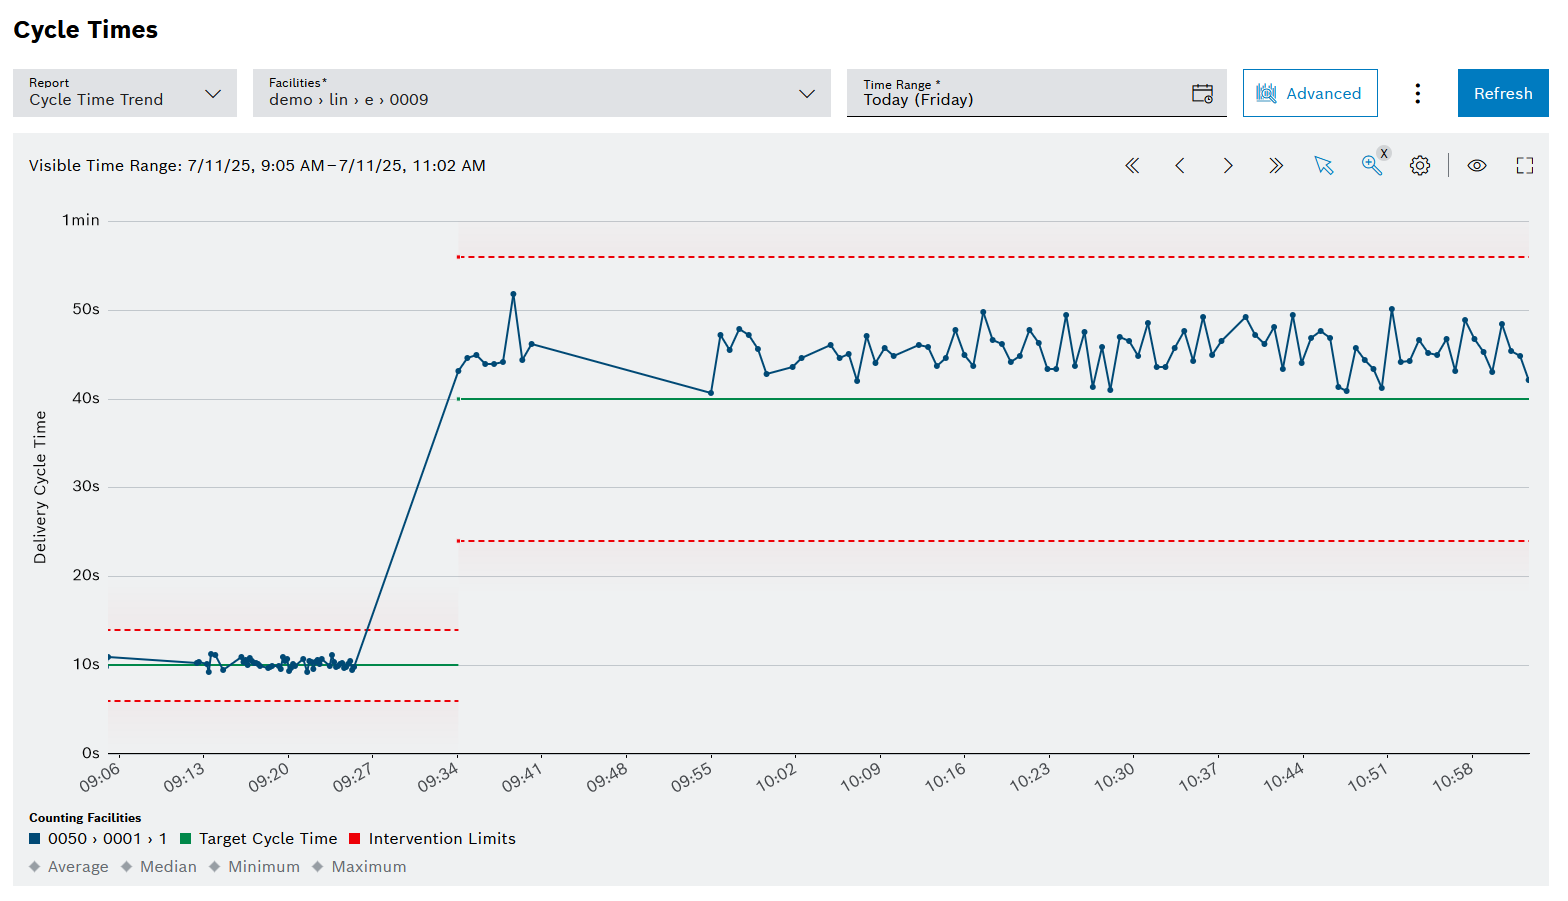
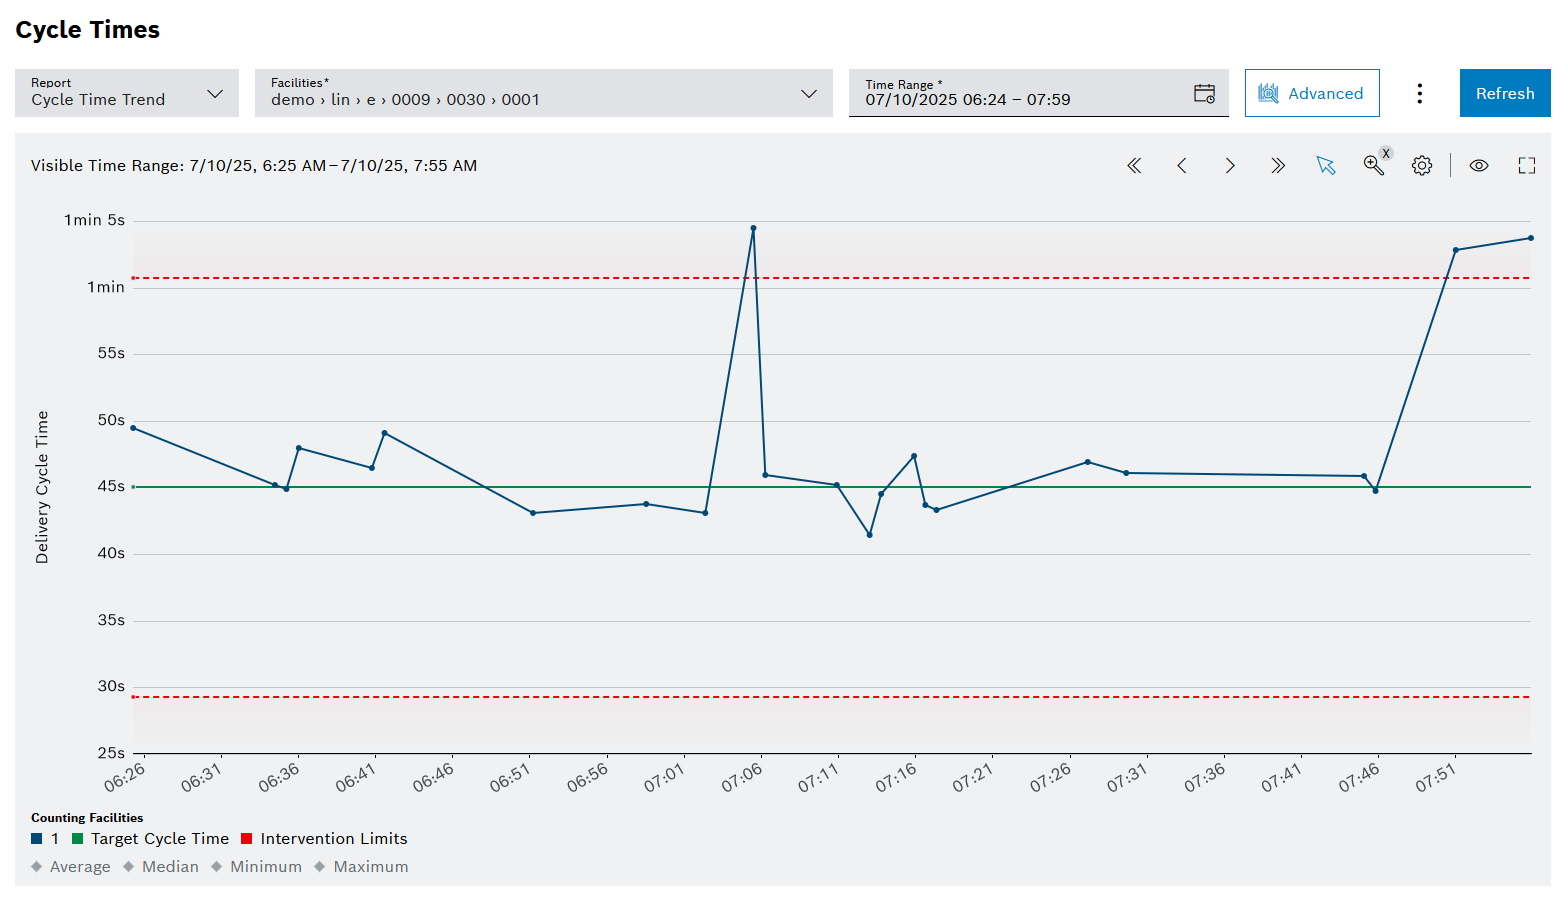
Delivery cycle time
The Delivery Cycle Time shows all cycles whose cycle time deviates from the target cycle time by a maximum of the Production Timeout Threshold value (see Administration → Configuration → System Configuration), regardless of whether equipment events occurred within the cycle or not.
|
Delivery Cycle Time is helpful when the equipment has no capability to detect interruptions in the process cycle (e.g. error, jam, part missing) and filters out extreme cycle times. |
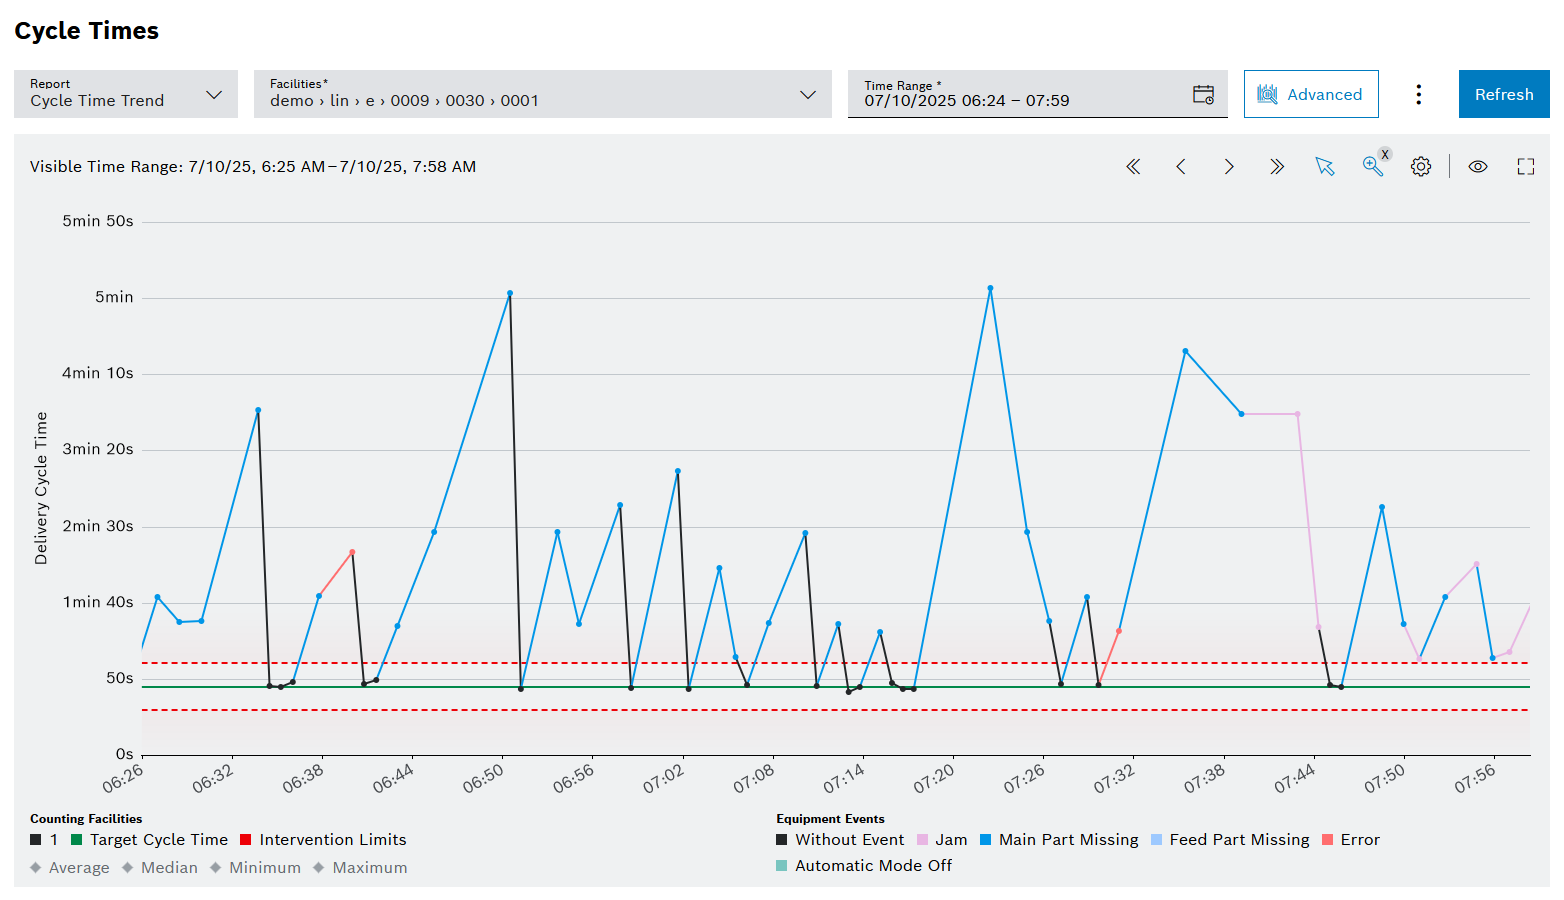
Reference cycle time
The Reference Cycle Time shows only cycles which no equipment event or one of the events selected under Additional Equipment Events within occurred. All other cycles are being filtered out.
|
The color of the data point itself and the connecting line before it indicates which kind of equipment event occurred within the cycle. If different kinds of events occurred in one single cycle, the event with the highest priority is displayed. Priority of events (from highest to lowest): Jam, Main Part Missing, Feed Part Missing, Error, Automatic Mode Off. For data points and connecting lines in black, no equipment event was detected. |
|
Reference cycle time is only helpful when the equipment has the capability to detect interruptions in the process cycle (e.g. error, jam, part missing). |
Select no Additional Equipment Events to see the Reference Cycle Time: Good cases of process cycles without any interruptions to analyze the process itself regardless of errors, jam or part missing.
Select one or more Additional Equipment Events to see the Effective Cycle Time: Process cycles also with interruptions to analyze the process and the occurring errors, jams or part missing to consider the whole part flow in the production line.