Downtimes
The following reports are available:
Pareto downtime causes
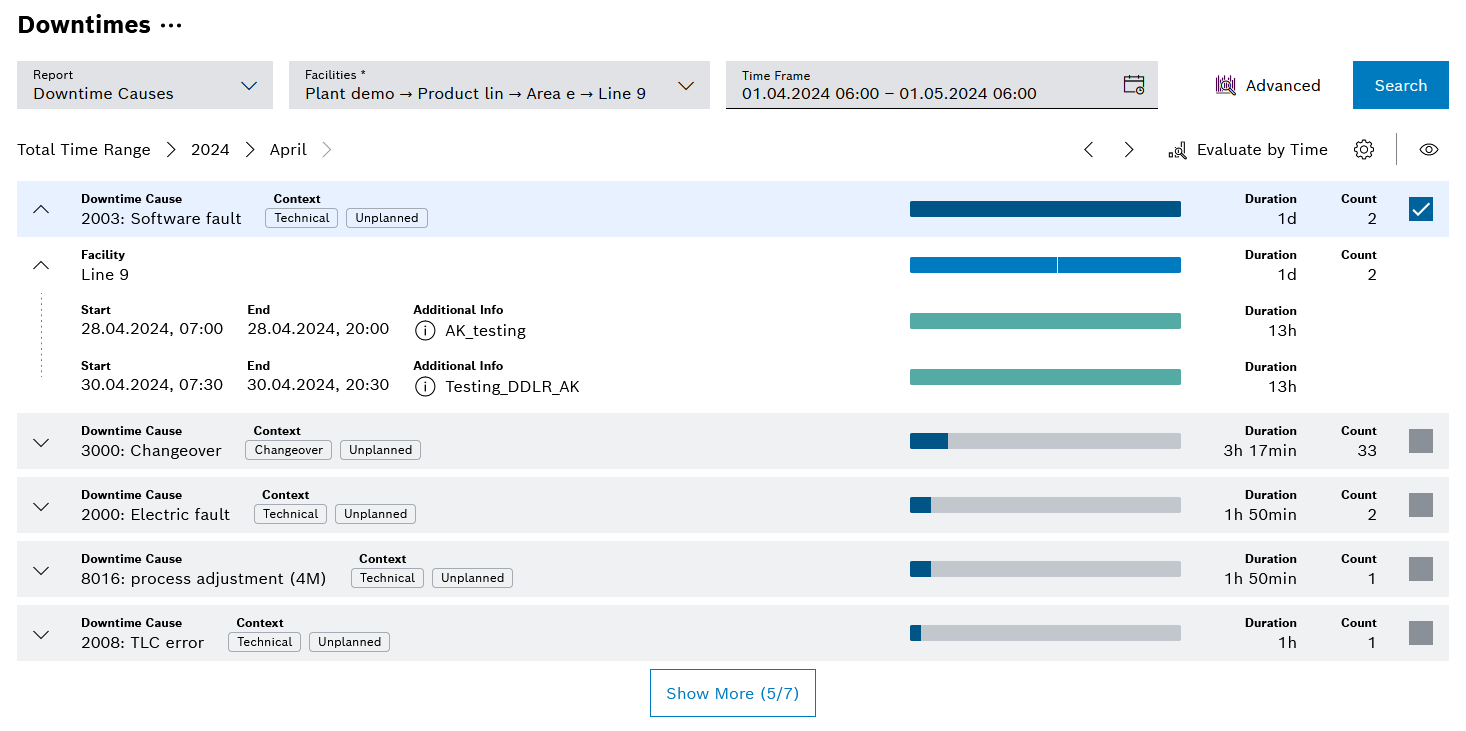
The Pareto Downtime Causes report shows downtimes with downtime causes in the form of a Pareto chart.
| Element | Description | ||
|---|---|---|---|
Downtime cause |
Number and name of the downtime cause |
||
Duration (bar) |
Duration of the downtime in the form of a bar
|
||
Duration |
Duration of the downtime(s) |
||
Count |
Number of downtimes that occurred |
||
Facility |
Facility at which this downtime occurred. |
||
Additional information |
Further information on the downtime |
||
|
By activating one or more checkboxes, you can click on Evaluate over time to display these cause(s) in the Downtimes by time report. |

Diagram options
| Element | Description | ||
|---|---|---|---|
Display |
Selection between Durations with Overlaps, Merged Durations and Line Loss Impact Durations
|
||
Order By (Descending) |
Selection between Duration and Count |
||
Number of Rows |
Number of rows showed by default and added by clicking Show More |
||
Simplified View |
Shows the downtimes in the form of a Pareto bar chart
|
||
Downtime Category |
Selection of the downtime category: Technical, organizational, changeover-related and quality |
||
Type |
Selection of the downtime type: Planned and unplanned, only planned, or only unplanned |
Facilities pareto
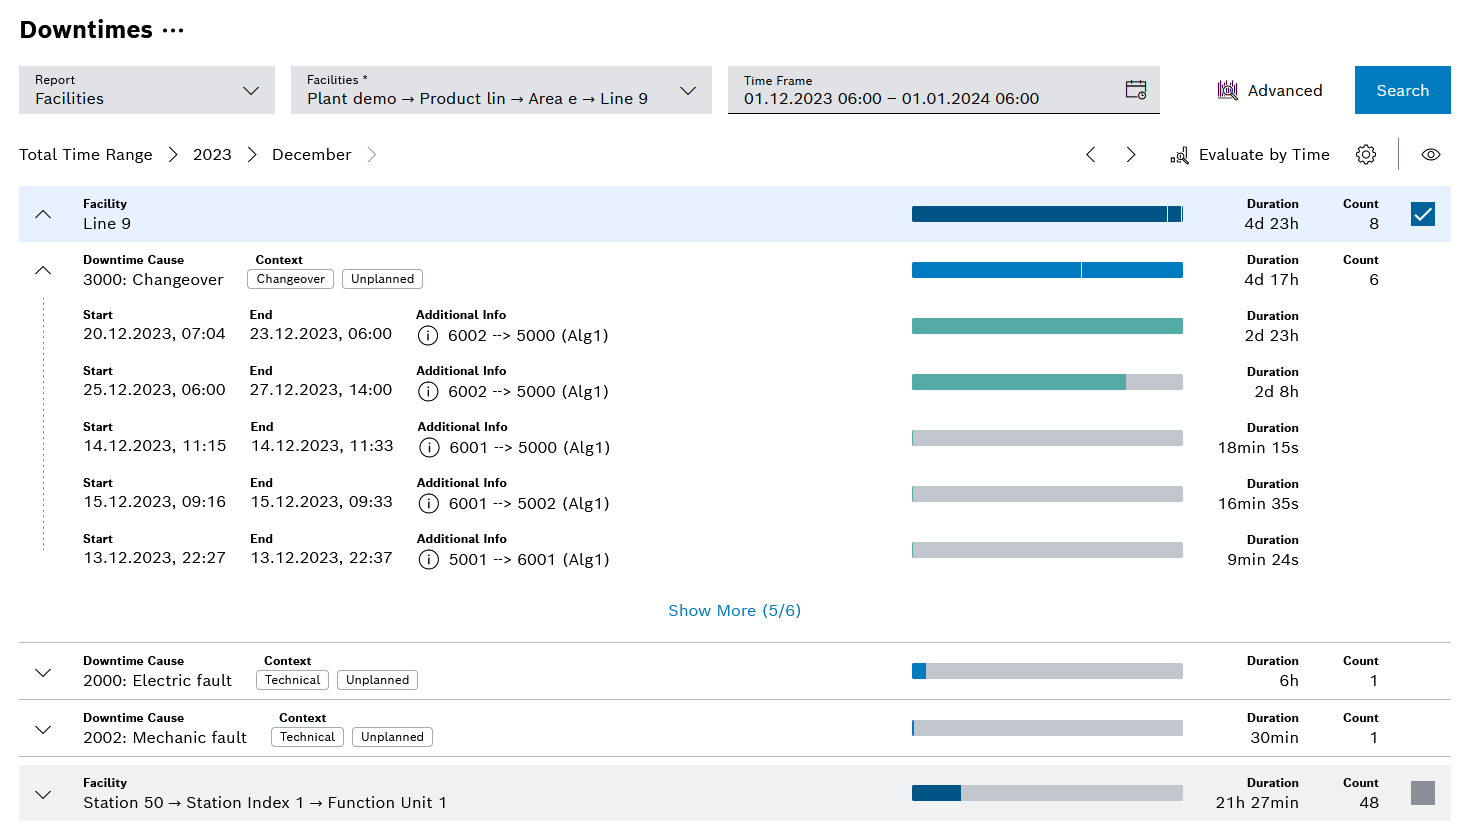
The Facilities Pareto report shows downtimes over facilities in the form of a Pareto chart.
| Element/icon | Description | ||
|---|---|---|---|
Downtime cause |
Number and name of the downtime cause |
||
Duration (bar) |
Duration of the downtime in the form of a bar
|
||
Duration |
Duration of the downtime(s) |
||
Count |
Number of downtimes that occurred |
||
Facility |
Facility at which this downtime occurred. |
||
Additional information |
Further information on the downtime |
||
|
By marking one or more facilities, you can click on Evaluate over time to display the cause(s) in the Downtimes by time report |
Diagram options
| Element | Description | ||
|---|---|---|---|
Display |
Selection between Durations with Overlaps, Merged Durations and Line Loss Impact Durations
|
||
Number of Rows |
Number of rows showed by default and added by clicking Show More |
||
Downtime Category |
Selection of the downtime category: Technical, organizational, changeover-related and quality |
||
Type |
Selection of the downtime type: Planned and unplanned, only planned, or only unplanned |
Line loss impact durations
The Line Loss Impact Durations diagram shows time-sorted, output-related losses at the end of the line. Losses marked in blue can be assigned to a downtime; purple-colored losses cannot be assigned to a downtime.
A Pareto chart of the downtimes that can be assigned to a line loss and the respective duration of the line loss are also displayed.
To display the Line Loss Impact Durations diagram, click on the Line Loss Impact Durations view in the diagram options of the Downtimes report.
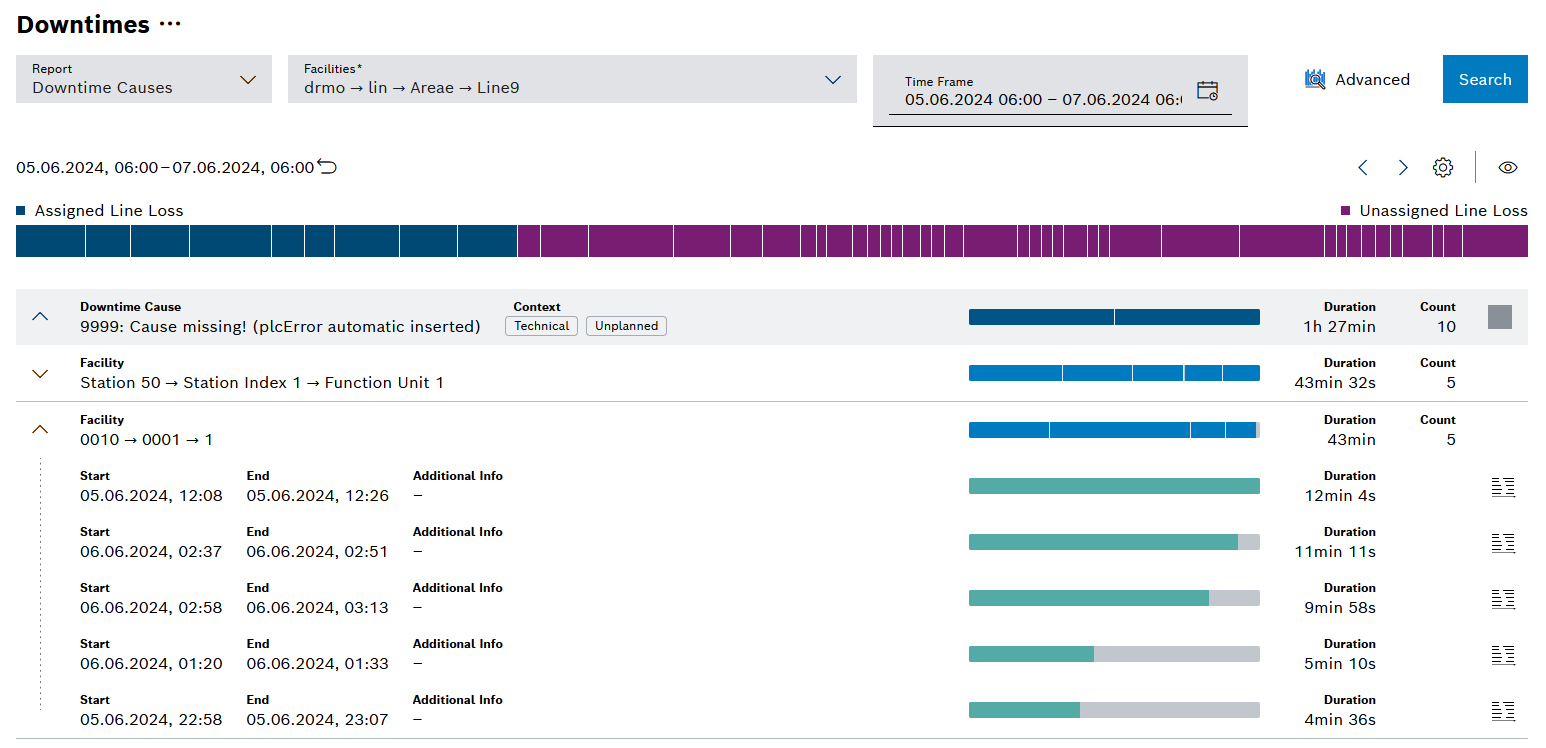
Display of downtimes as Pareto (such as Downtime causes Pareto ) with the following differences:
| Element | Description |
|---|---|
Start |
Start of downtime |
End |
End of downtime |
Duration |
Duration of the associated line loss |
|
Graphical display of Line Loss Backtracking |
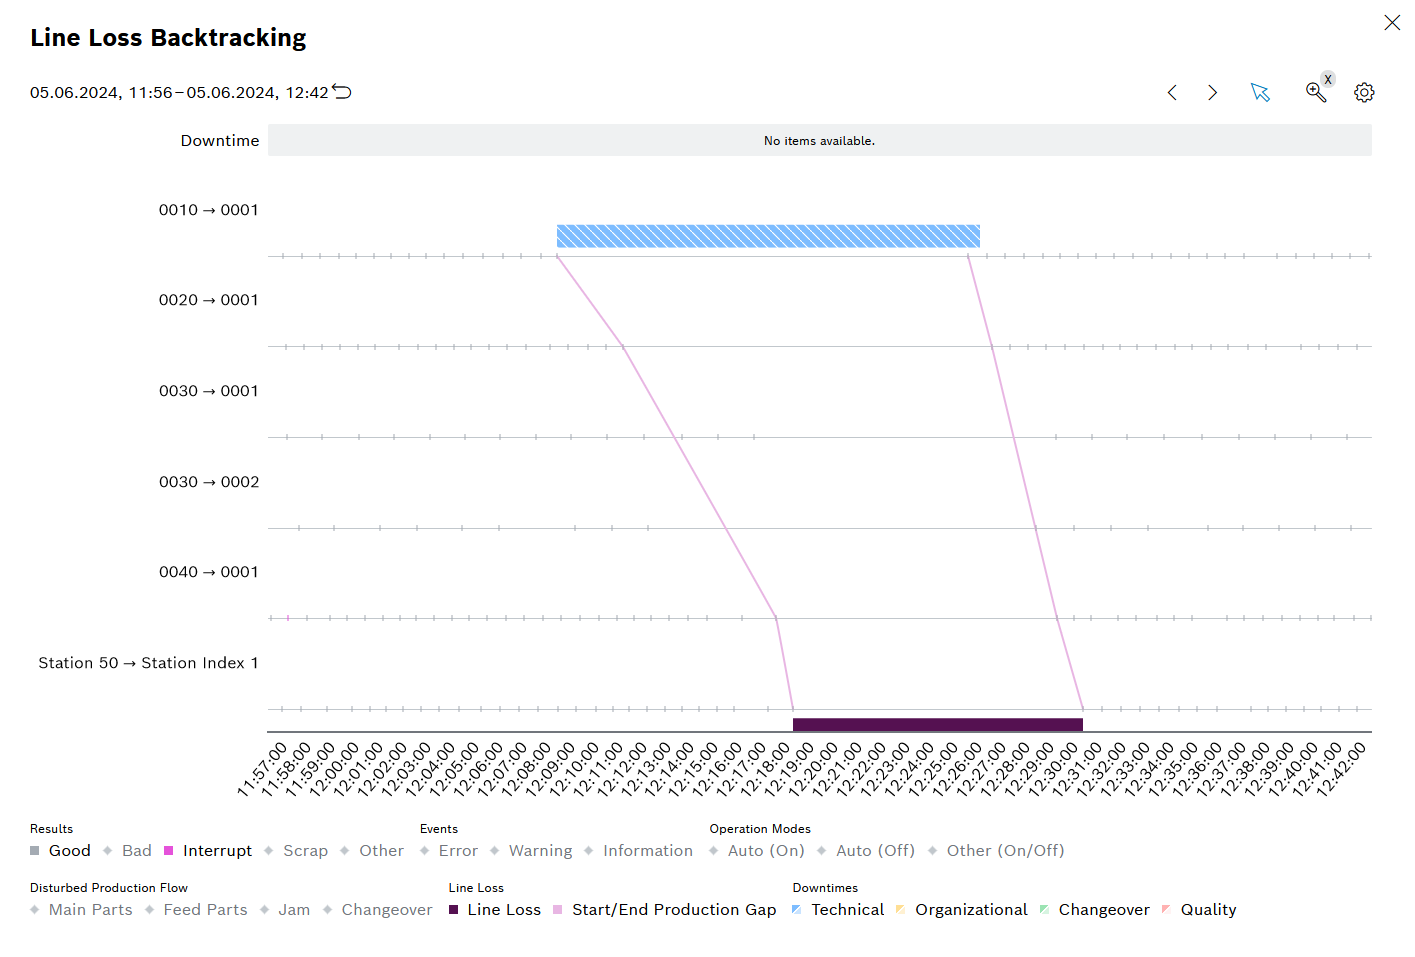
Line loss backtracking
To display the Line Loss Backtracking graphically, click on the corresponding blue or purple bar or on  .
.
The graphic shows the downtime, the trend of the determined production gap across the individual facilities in line graph form (delimited by pink lines), and the assigned output-related losses at the end of the line (purple):
Legend
Click on the elements in the legend to show or hide them. Hidden elements are grayed out in the legend and the preceding icon is rotated.
| Element | Description |
|---|---|
Results |
Category of process results (good, bad, abort, scrap, other) |
Events |
Category of facility events (error, warning, information) |
Operating Modes |
Displays the operating mode of the setup event, such as Auto (On), Auto (Off), and Other (On/Off) |
Disturbed Production Flow |
Shows the reason for the distrubed production flow (main parts missing, feed parts missing, jam, changeover) |
Line loss |
Shows the line loss and its start/end |
Downtimes |
Category of downtime (technical, organizational, changeover-related, quality) |
Pareto downtime causes with history
The Pareto downtime causes with history report shows downtime causes as a Pareto and additionally with history.
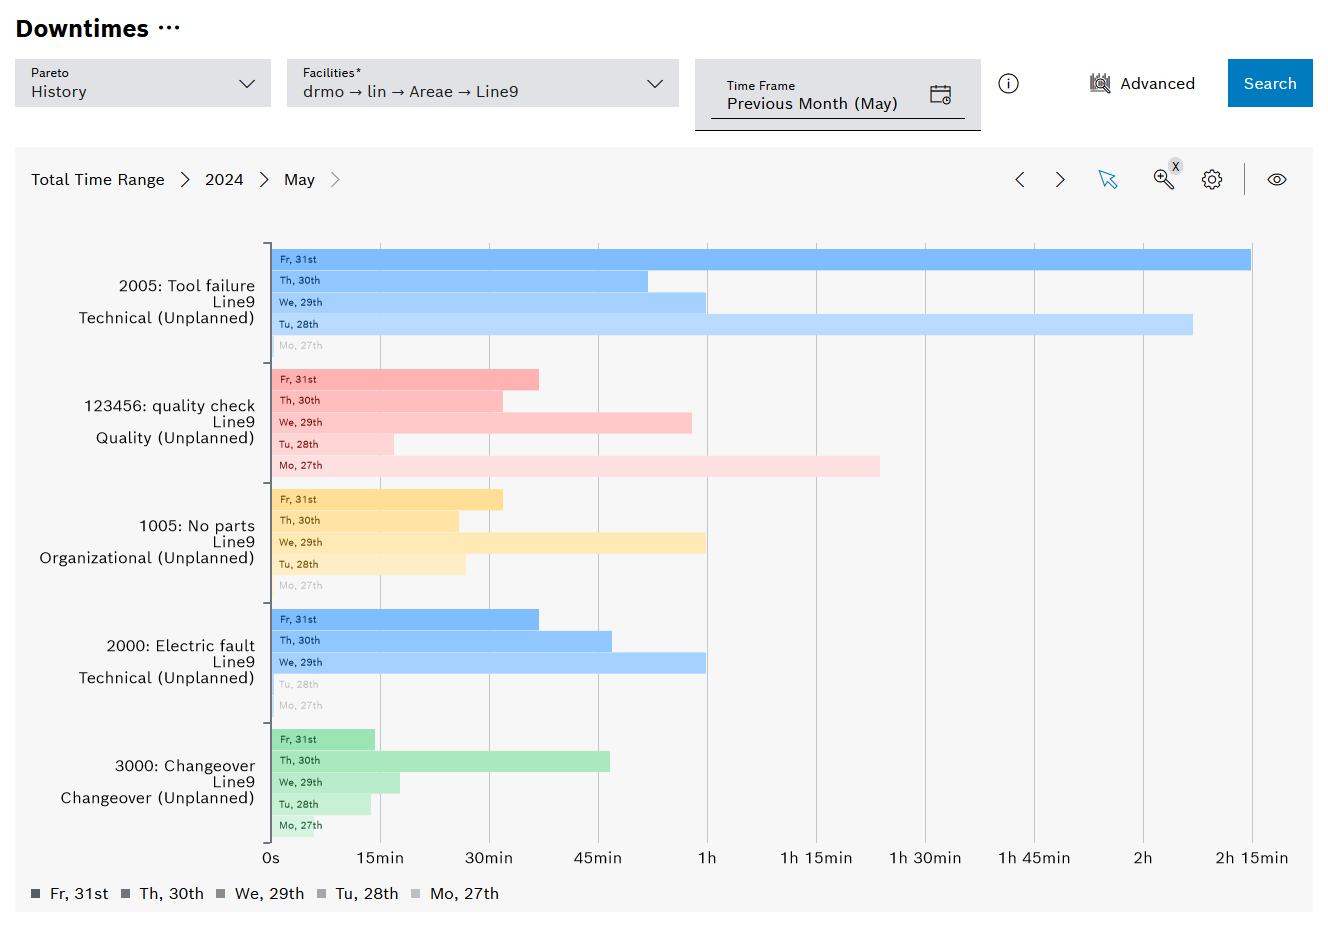
Depending on the query period, the report groups the history by day, month or year. The facility aggregation level (line, station, station index, function unit, …) and the number of groupings can be selected automatically or manually in the advanced settings.
|
The time range is limited from the end by the selected history length |
|
Downtime cause bar groups are sorted descending by the last (uppermost) history group |
Diagram options:
| Element | Description |
|---|---|
Downtime Category |
Selection of the downtime category: Technical, organizational, changeover-related and quality |
Downtime Type |
Selection of the downtime type: Planned and unplanned, only planned, or only unplanned |
View history |
Display Pareto with or without historical history |
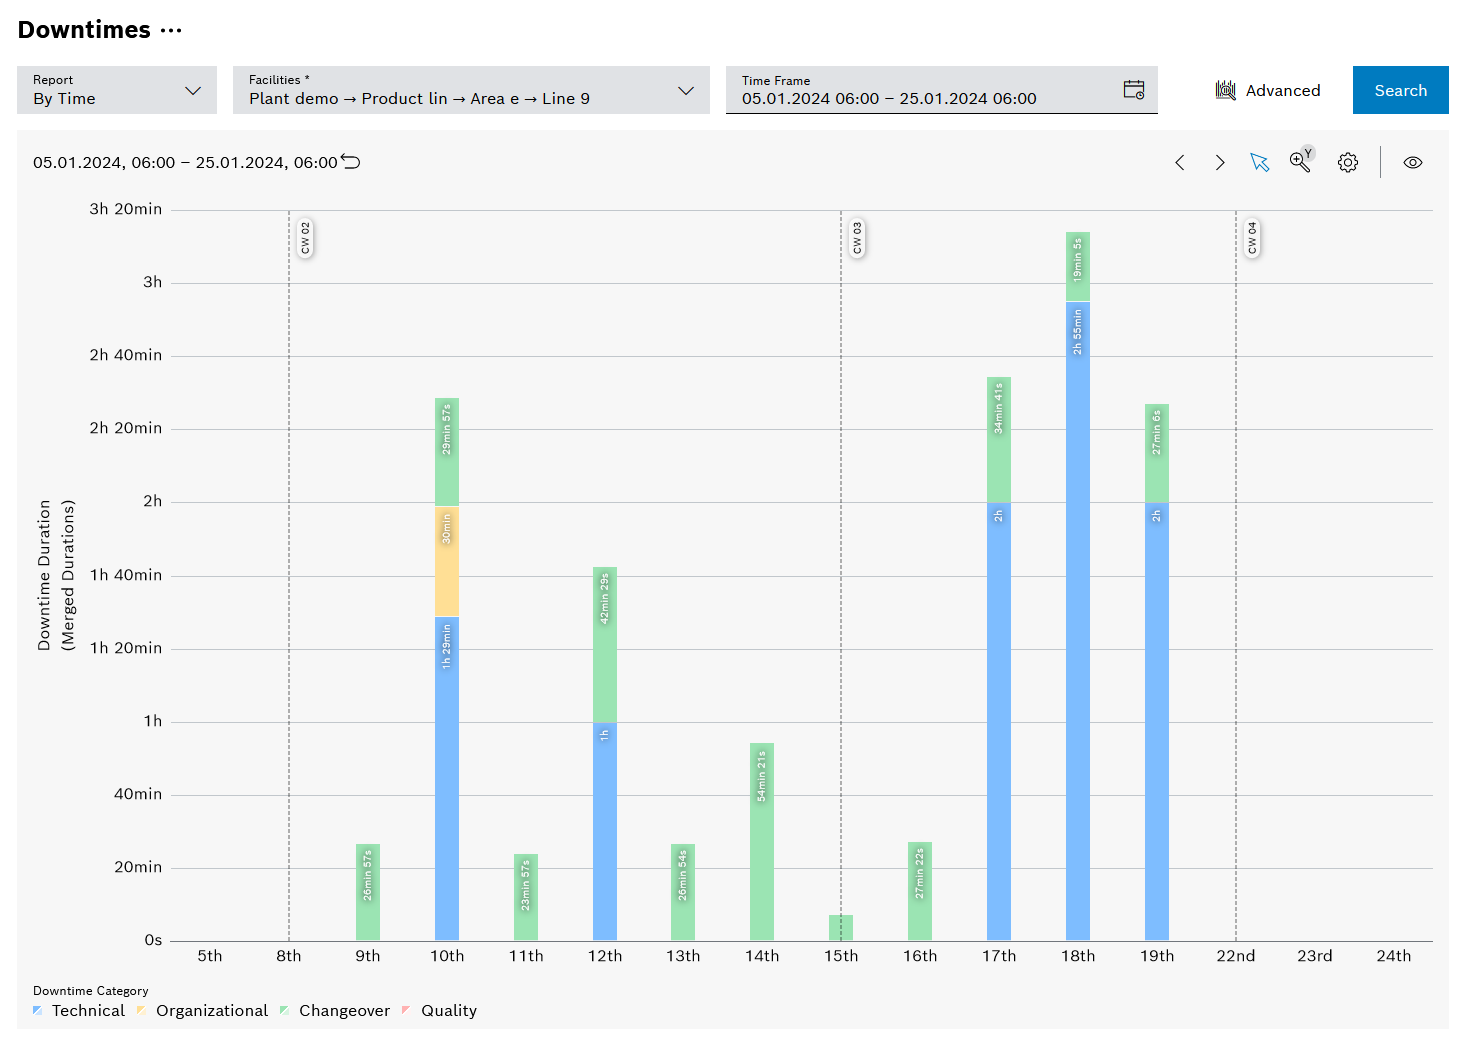
Downtimes by time
The Downtimes by time report shows an overview of downtime durations, stacked by downtime categories.
Open the report via the Report > Group By Time drop-down list.
Legend
Click on the elements in the legend to show or hide them. Hidden elements are grayed out in the legend and the preceding icon is rotated.
| Element | Description |
|---|---|
Technical |
Downtimes, for example due to a mechanical fault |
Organizational |
Downtimes, for example due to lack of associates |
Changeover |
Downtimes, for example due to changeover processes |
Quality |
Downtimes, for example due to defective additional components |
Diagram options
| Element | Description | ||
|---|---|---|---|
Display |
Selection between Merged Durations and Durations with Overlaps
|
||
Split Days Into Shifts |
When activated, displays the downtimes per shift
|
||
Downtime Category |
Category of the downtime: Technical, organizational, changeover-related and quality |
||
Downtime Type |
Type of the downtime: Planned and unplanned, only planned, or only unplanned |
||
Visible Downtime Causes |
Selection of the downtime causes to be displayed |