Adjust display mode
Different display modes are available depending on the report:
-
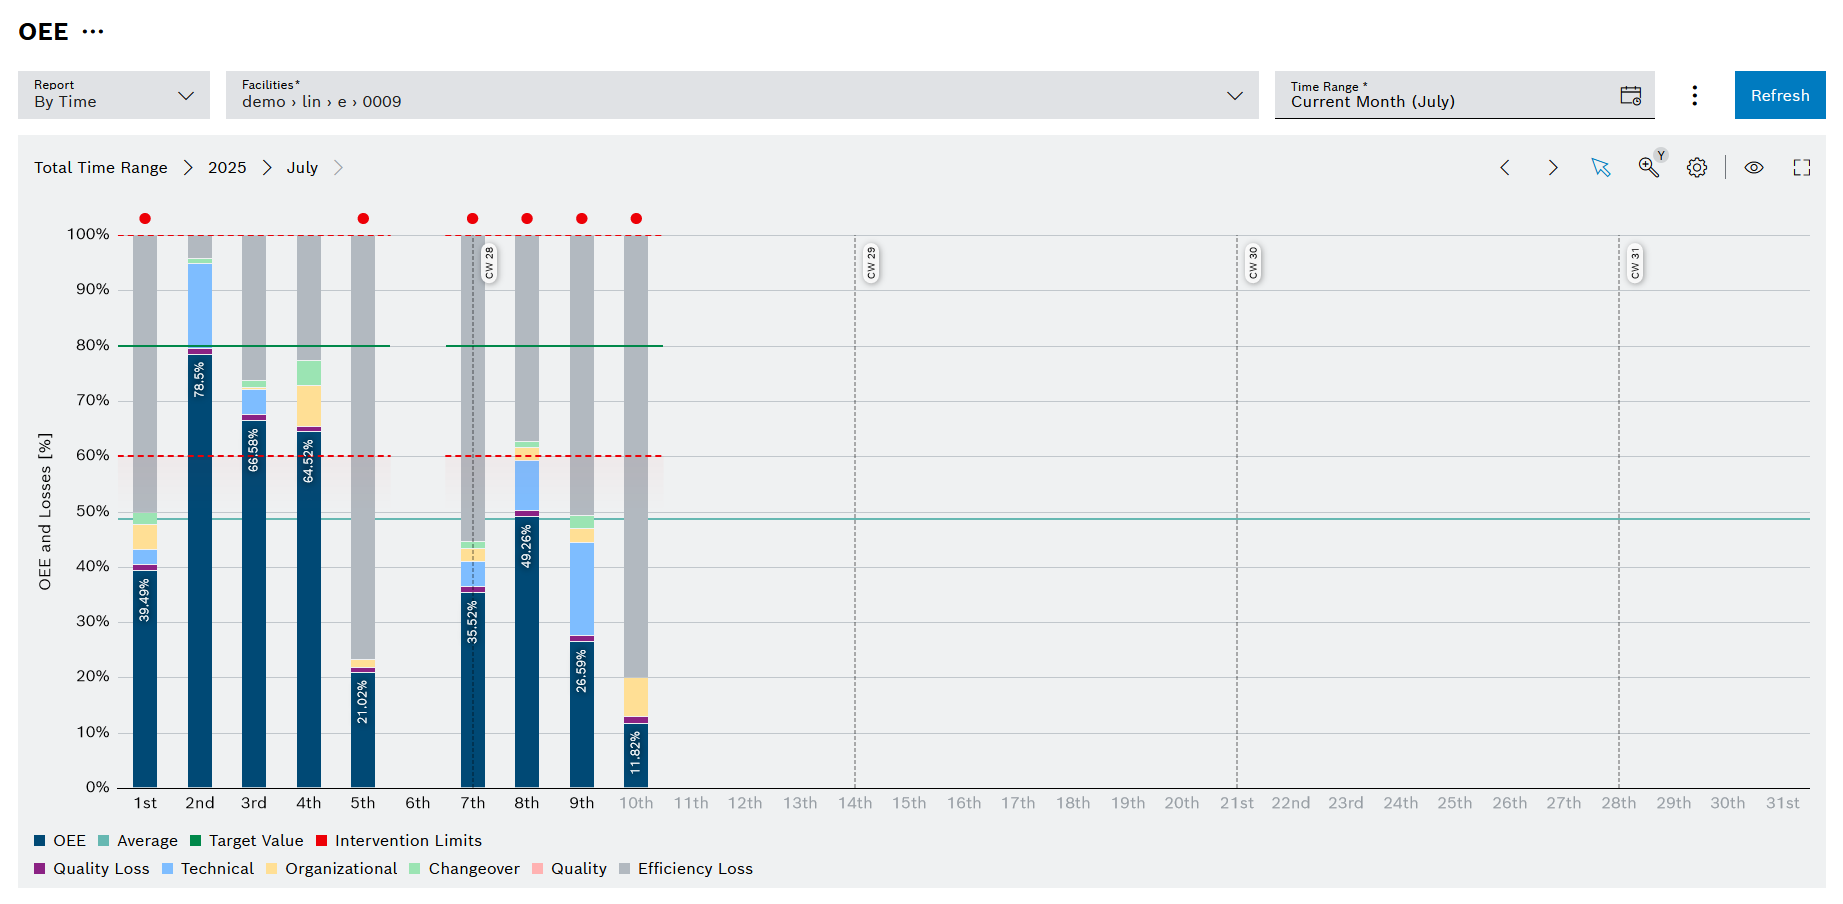
Diagram
-
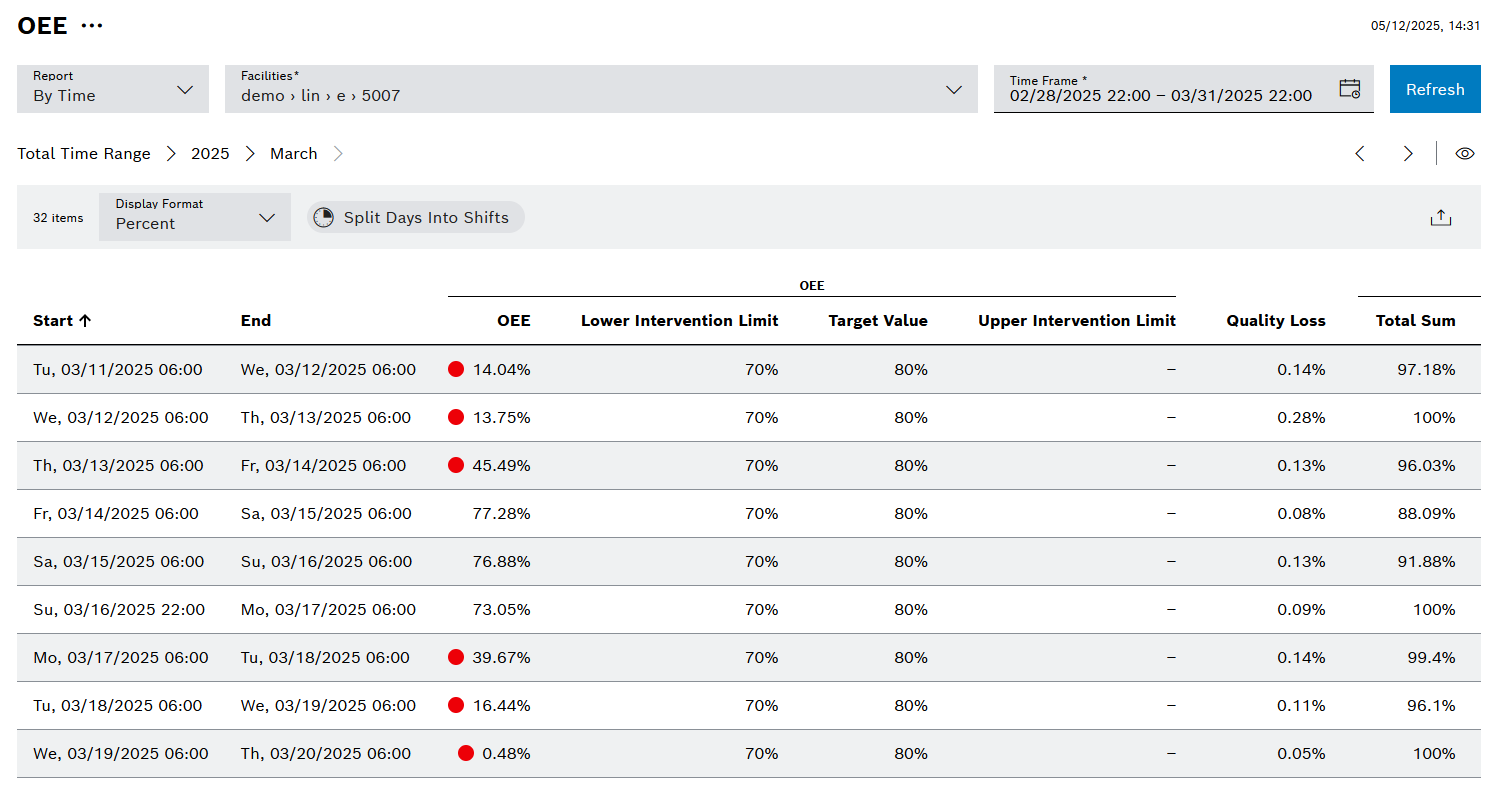
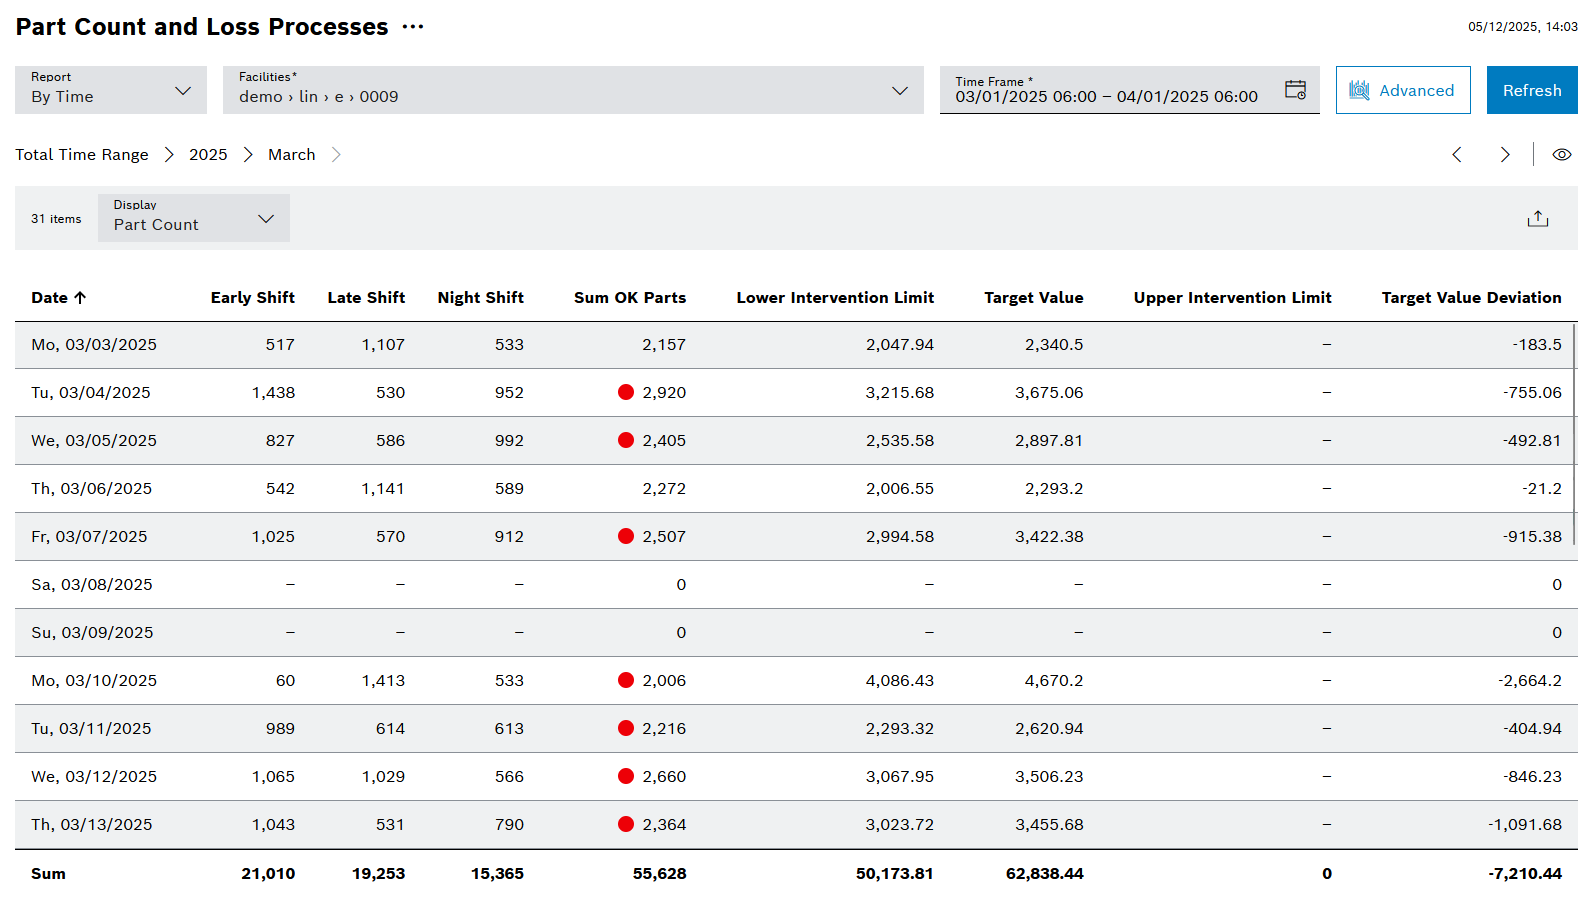
Table
-
Raw data
Prerequisite
KPI Reporting: User or KPI Reporting: Admin role
Procedure
-
Click
 .
. -
Select a display mode from the drop-down list.
The display mode is adjusted according to the selection.
Diagram display mode
The Diagram display mode shows the reports in a diagram.
| Element | Description |
|---|---|
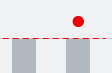
|
Indicator in red shows values outside intervention limit(s). |
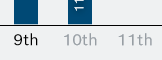
|
The current time span and time spans in future are shown in gray color. Time spans in the future will show no target values or intervention limits. |
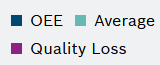
|
Click on legend color indicator to show/ hide the corresponding value category. |