Nexeed
    • Introduction
    • User manual
      • Condition monitoring
        • Live tab
        • Counters tab
        • Measurements tab
        • Events tab
        • Rules tab
        • View configuration tab
        • Details tab
      • Rules management
        • Rule types/standard functions
        • Rule details page
      • Function configuration
      • Condition Monitoring Widgets
    • API documentation
      • Condition Monitoring HTTP API
      • Rules Management HTTP API
    • Glossary
Condition Monitoring
  • Industrial Application System
  • Core Services
    • Block Management
    • Deviation Processor
    • ID Builder
    • Multitenant Access Control
    • Notification Service
    • Ticket Management
    • Web Portal
  • Shopfloor Management
    • Andon Live
    • Global Production Overview
    • KPI Reporting
    • Operational Routines
    • Shift Book
    • Shopfloor Management Administration
  • Product & Quality
    • Product Setup Management
    • Part Traceability
    • Process Quality
    • Setup Specs
  • Execution
    • Line Control
    • Material Management
    • Order Management
    • Packaging Control
    • Rework Control
  • Intralogistics
    • AGV Control Center
    • Stock Management
    • Transport Management
  • Machine & Equipment
    • Condition Monitoring
    • Device Portal
    • Maintenance Management
    • Tool Management
  • Enterprise & Shopfloor Integration
    • Archiving Bridge
    • Data Publisher
    • Direct Data Link
    • Engineering UI
    • ERP Connectivity
    • Gateway
    • Information Router
    • Master Data Management
    • Orchestrator

Nexeed Learning Portal

  • Condition Monitoring
  • User manual
  • Condition monitoring
  • Live tab

Live tab

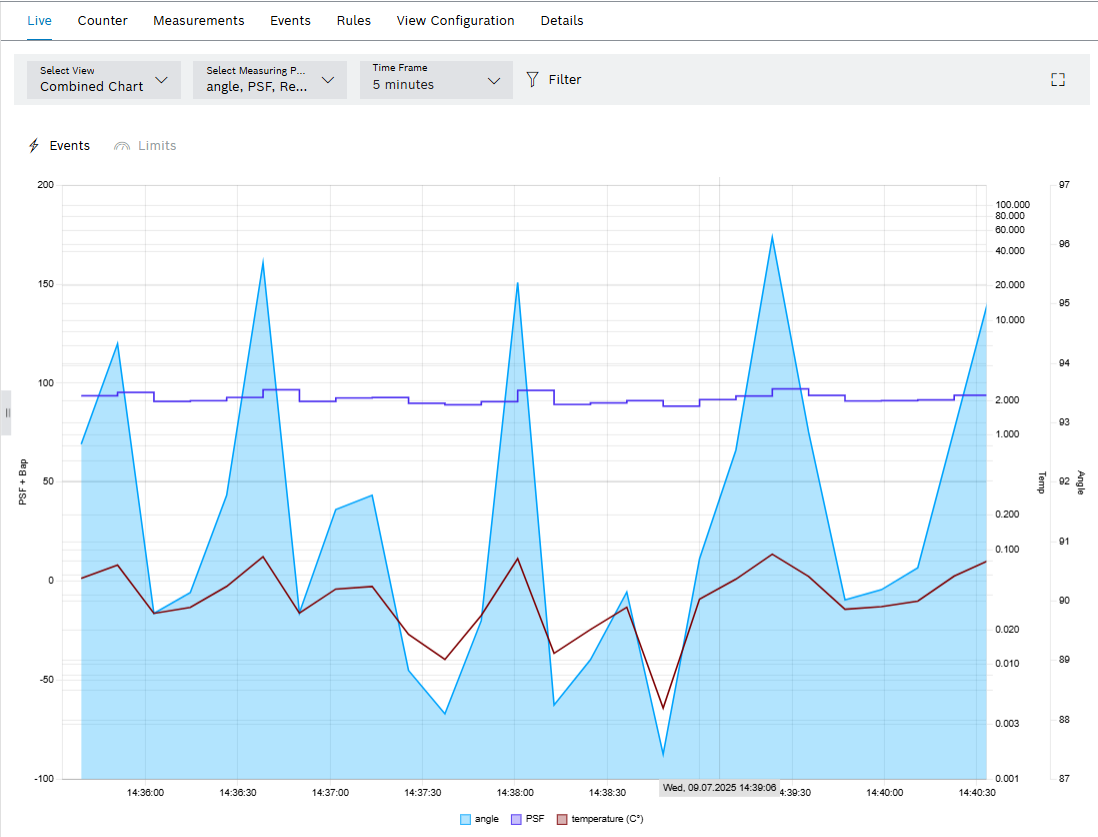
In this device specific view, the current measured values of the device are displayed live. All measuring points will visualize as defined of the selected view. Views can be configured in the View configuration tab. These measuring points will displayed in a defined timeframe aggregation. In addition, events and limit values can be visualized.

cm_live_view_chart
Element Description

Select view

Select a view from the drop-down list, or search by name. In default, the view All measuring points is selected.

The drop-down list displays all the device views created from the View Configuration tab.
View configuration tab

Select Measuring Point

Select the measuring point to be displayed from the drop-down list.

The drop-down list displays all created measurement points for the device.
Measuring points

Maximum 10 measuring points can be visualized at once.

Time Frame

Select the time range in which the measured values are displayed.

By default, the last five minutes are displayed.

fullscreen Filter

In live view it is possible to filter displayed events by event code.

fullscreen

Open full-screen mode.

The full-screen mode can be closed with [ESC].

fullscreen Events

Show and hide events. By clicking multiple times, it displays all events, only the events of the selected measuring point or no events at all.

speedometer Limits

Show and hide limit values from the measured value messages.

Limits can only be displayed for one measuring point.

Contents

© Robert Bosch Manufacturing Solutions GmbH 2023-2025, all rights reserved

Changelog Corporate information Legal notice Data protection notice Third party licenses