Nexeed

Industrial Application System

    • Introduction
    • Getting started
      • Get access
      • Login
      • Main screen
      • Welcome dashboard
      • Process Anomaly Detection
      • Condition Monitoring
      • Morning meeting with KPIs
    • How-Tos
      • Set-up monitors on production lines
      • Try out the APIs
    • Integration guide
      • Underlying concepts
        • General
        • Onboarding
        • Security
        • Communication
      • Integration journey
      • Overview of APIs
    • Further information and contact
Industrial Application System
  • Industrial Application System
  • Core Services
    • Block Management
    • Deviation Processor
    • ID Builder
    • Multitenant Access Control
    • Notification Service
    • Reporting Management
    • Ticket Management
    • Web Portal
  • Shopfloor Management
    • Andon Live
    • Global Production Overview
    • KPI Reporting
    • Operational Routines
    • Shift Book
    • Shopfloor Management Administration
  • Product & Quality
    • Product Setup Management
    • Part Traceability
    • Process Quality
    • Setup Specs
  • Execution
    • Line Control
    • Material Management
    • Order Management
    • Packaging Control
    • Rework Control
  • Intralogistics
    • AGV Control Center
    • Stock Management
    • Transport Management
  • Machine & Equipment
    • Condition Monitoring
    • Device Portal
    • Maintenance Management
    • Tool Management
  • Enterprise & Shopfloor Integration
    • Archiving Bridge
    • Data Publisher
    • Direct Data Link
    • Engineering UI
    • ERP Connectivity
    • Gateway
    • Information Router
    • Master Data Management
    • Orchestrator
Nexeed Learning Portal
  • Industrial Application System
  • Getting started
  • Process Anomaly Detection
✎

Process Anomaly Detection

This tutorial focuses on analyzing processes and identifying issues in the process results.

Explore details and further use-cases in the documentation of Process Quality

1. Analyze processes

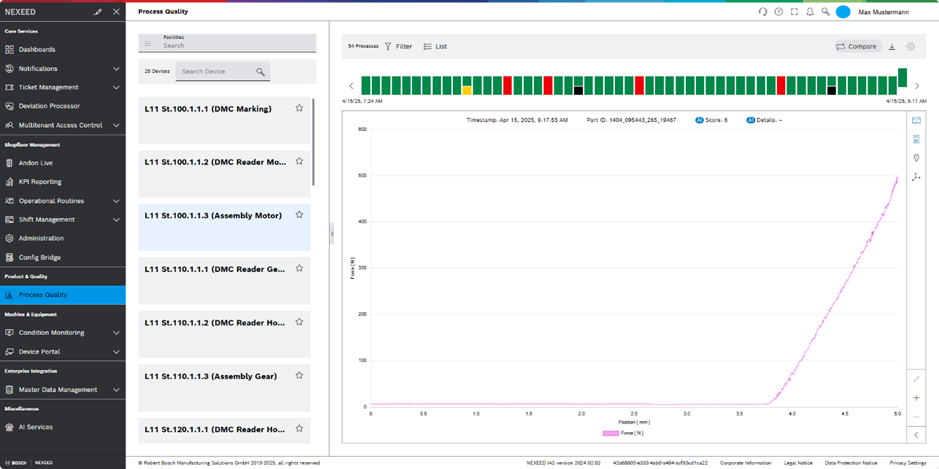
To open the process visualization, follow these steps:

  1. In the main menu, go to Product & Quality > Process Quality.

  2. Click on the device L11 St.100.1.1.3 (Assembly Motor).

  3. Select any of the process represented by a vertical bar on top of the chart

The graph shows of the data captured during the motor turning process.

pq1

2. Check the results of the Anomaly Detection

To get information about found anomalies in your process data, follow these steps:

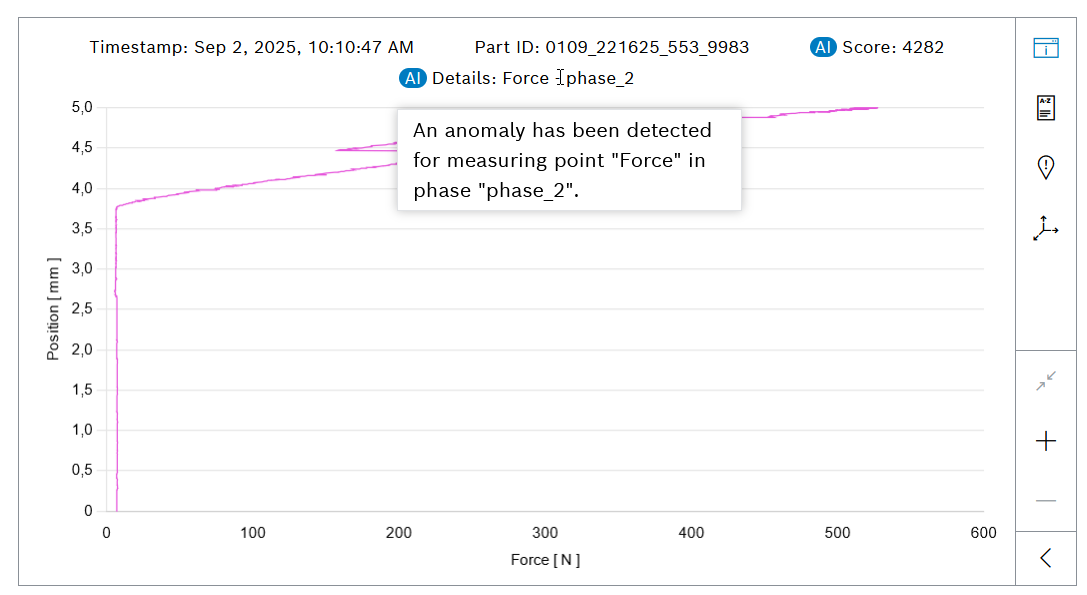
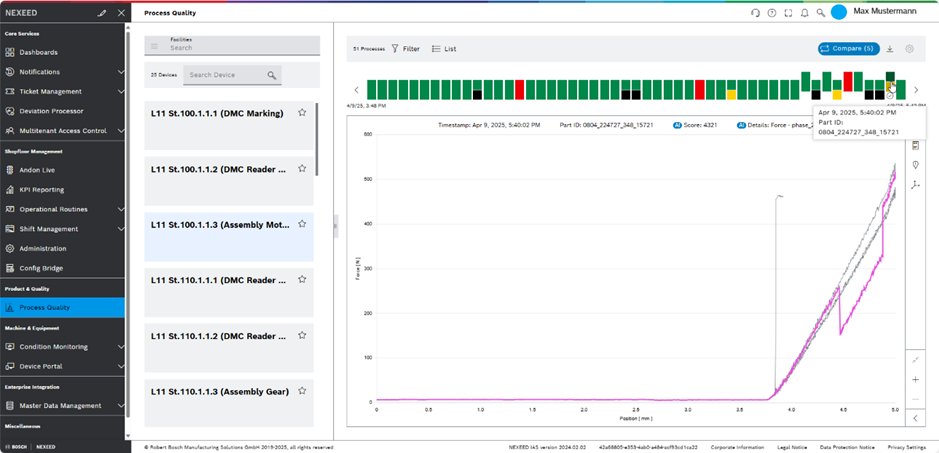
Yellow bars indicate process anomalies.
  1. Click on a bar with a yellow marking.

  2. To get additional information of the anomaly, hover the cursor over the yellow bar and explore the pop-up.

  3. To visually compare this process data graph with another, right-click multiple bars.

Multiple graphs including the one with an anomaly detected show in the graph area.

pq2

3. Browse trained AI models

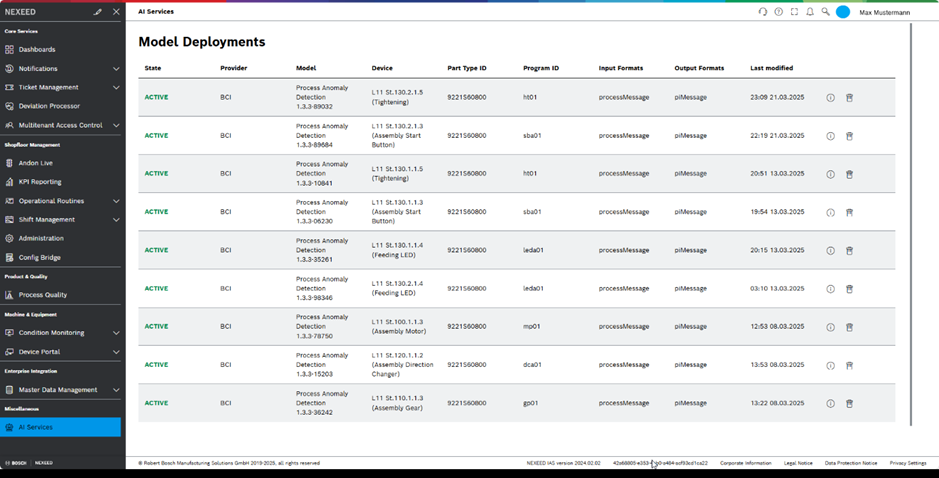
To view and manage the models trained by the various AI implementations, go to AI services module in the navigation.

You can see all AI models, their status, and additional information.

pq3

Contents

© Robert Bosch Manufacturing Solutions GmbH 2023-2025, all rights reserved

Changelog Corporate information Legal notice Data protection notice Third party licenses