Detecting process anomalies
This tutorial focuses on analyzing processes and identifying issues in the process results. The following tasks can be performed:
| Explore details and further use-cases in the documentation of Process Quality |
Analyzing processes
-
Open the Process Quality menu entry.
-
Click on L11 St.100.1.1.3 (Assembly Motor).
-
Click on a vertical bar on top of the chart.
The selected process is moved upward in the status bar.
The graph displays the data captured during the process.
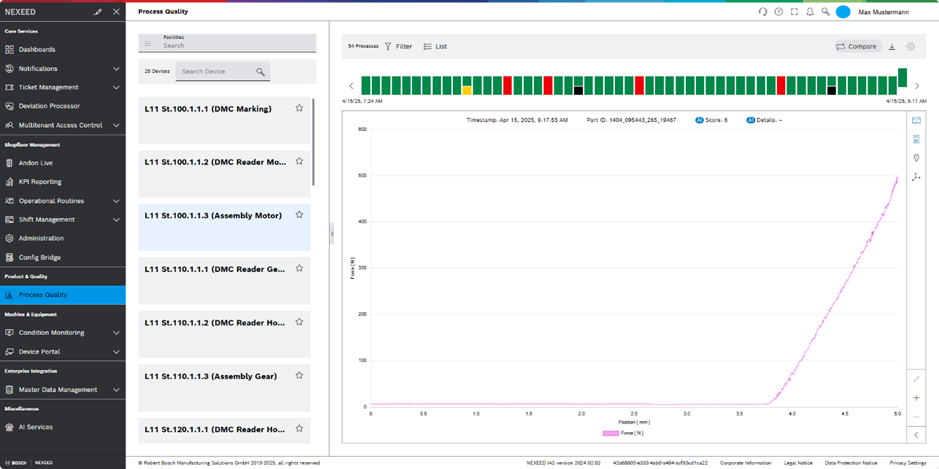
Checking the results of the anomaly detection
| Yellow bars indicate process anomalies. |
-
Open the Process Quality menu entry.
-
Click on L11 St.100.1.1.3 (Assembly Motor).
-
Click on a yellow bar on top of the chart.
The selected process is moved upward in the status bar.
The graph displays the data captured during the process. -
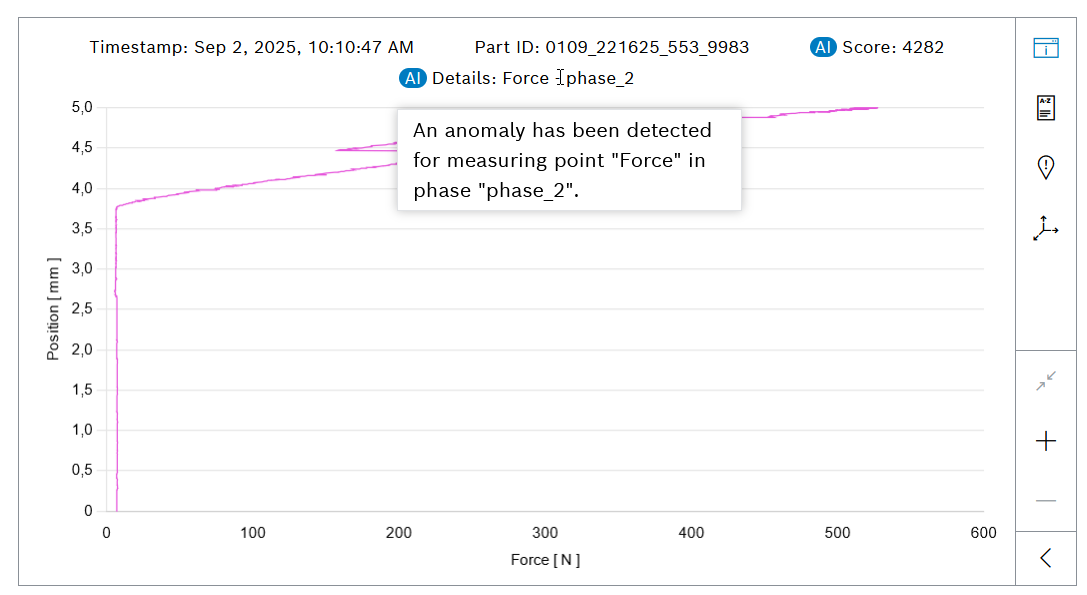
To get further information, move the mouse over AI Details.
A pop-up opens showing details of the anomaly.
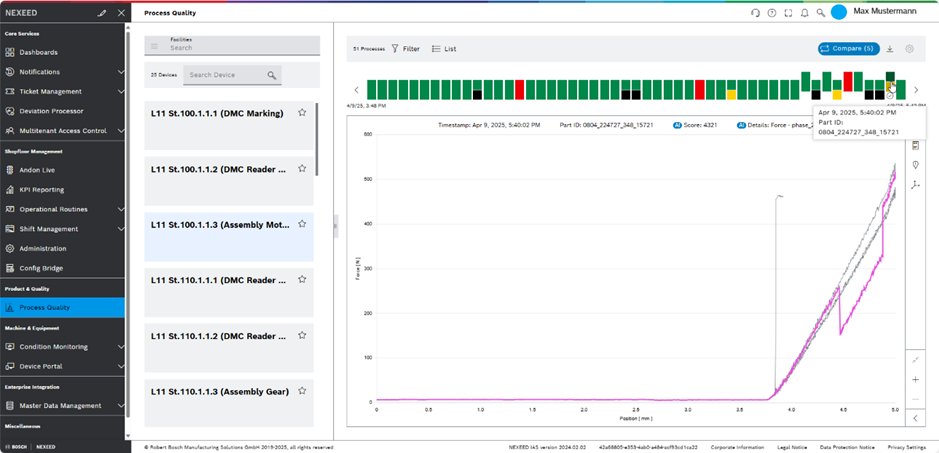
Comparing process data graphs
Process data graphs can be compared with others.
-
Open the Process Quality menu entry.
-
Click on L11 St.100.1.1.3 (Assembly Motor).
-
Click on
 .
. -
Select at least two processes in the status bar.
The selected processes are moved upward in the status bar.
The process curves of the selected processes are displayed in the diagram.