Analyzing data and detecting event sequences
This tutorial offers a quick introduction into the topic of condition monitoring and predictive maintenance using both manual and advanced automatic analysis methods.
The following tasks can be performed:
| Explore details and further use-cases in the documentation of Condition Monitoring |
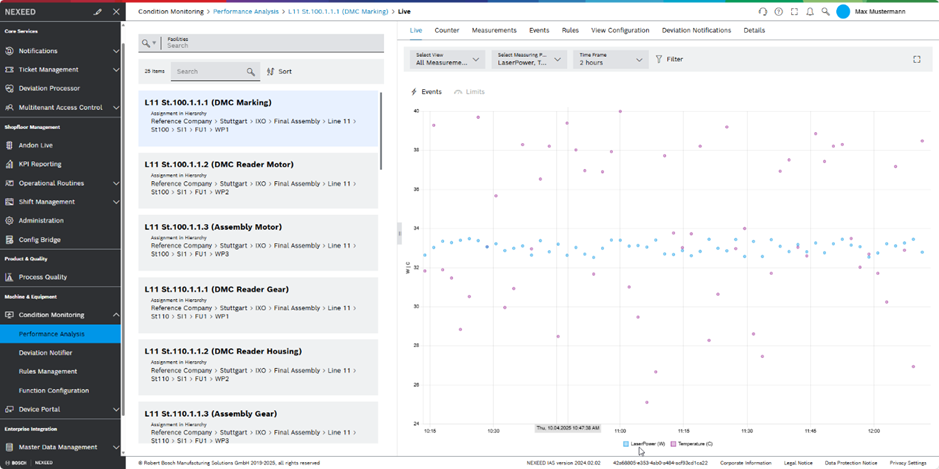
Analyzing machine data
-
Open the Condition Monitoring > Performance Analysis menu entry.
-
Select the station L11 St.100.1.1.1 (DMC Marking).
-
Extend the Time Frame for a broader look on the machine measurements.
The chart shows the machine measurements over the selected time span and updates the graph every time new data is available.
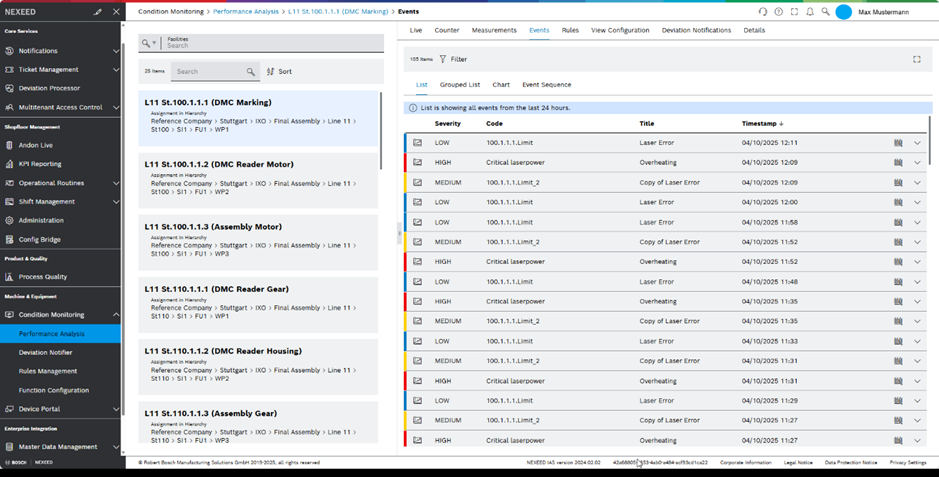
Getting the latest events
-
Open the Condition Monitoring > Performance Analysis menu entry.
-
Select the station L11 St.100.1.1.1 (DMC Marking).
-
Click on the Events tab.
The table shows the most recent machine events.
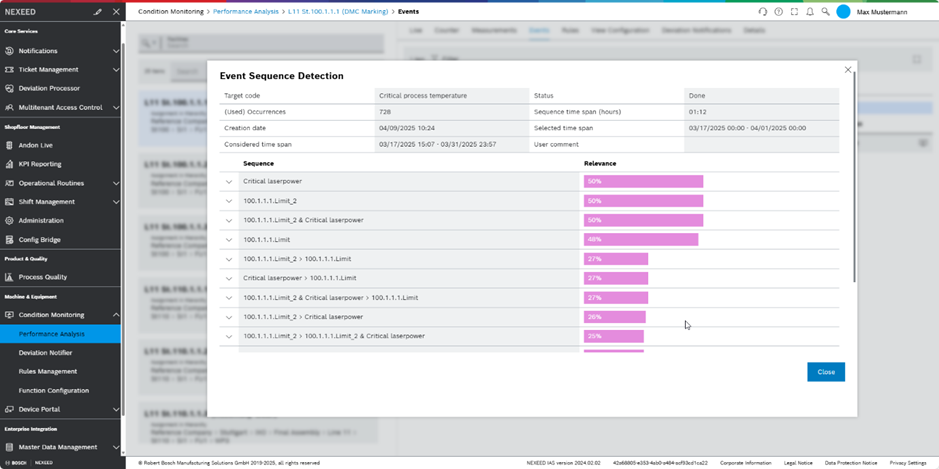
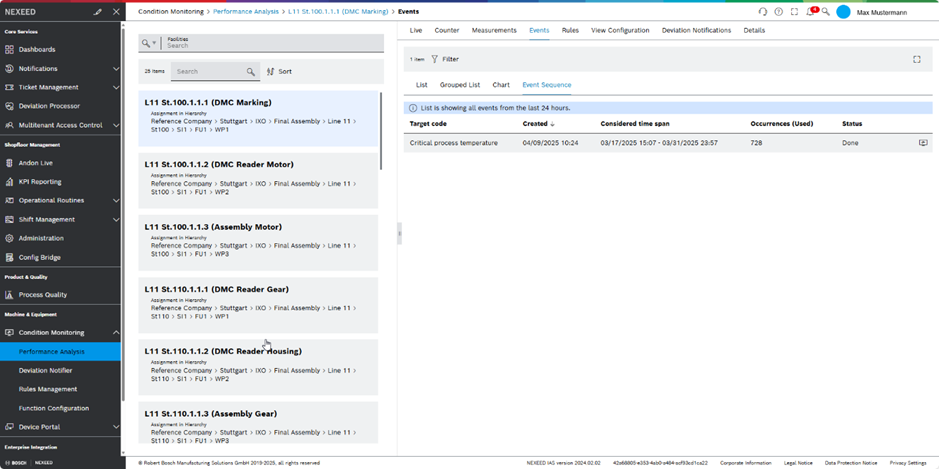
Triggering an event sequence detection run
-
Open the Condition Monitoring > Performance Analysis menu entry.
-
Select the station L11 St.100.1.1.1 (DMC Marking).
-
Click on the Event tab.
-
Click on the Event Sequences tab.
-
To start a new analysis, click on
 .
.
The pop-up shows the sequences identified by the algorithm and the statistical information.