Deviations
Examples of deviations include faults or downtimes in production. Production deviations are detected using other modules such as Shift Book or Condition Monitoring. The data collected about a deviation is transmitted to the Deviation Processor module and displayed in the table of deviations.
|
A deviation consists of one or more messages of a module. |
Filter deviations by time period
The table of deviations can be filtered by a specific time range.
|
Multiple filters can be set in combination with one another to provide a more accurate result. |
-
Call up the Deviations tab in the Shopfloor management > Deviation processor menu.
-
To filter the deviations by the time range in which they occurred, click
 in the Time frame field.
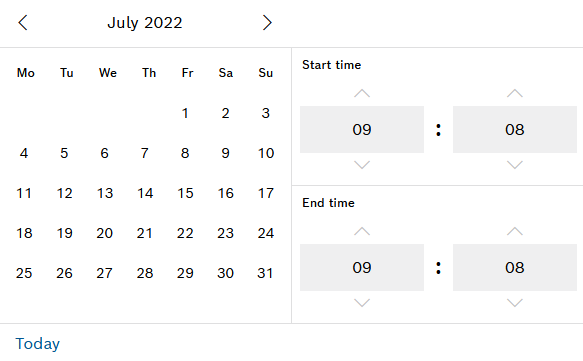
-
Select the start date and the start time of the desired time range under Start time.
-
Select the end date and the end time of the desired time range under End time.
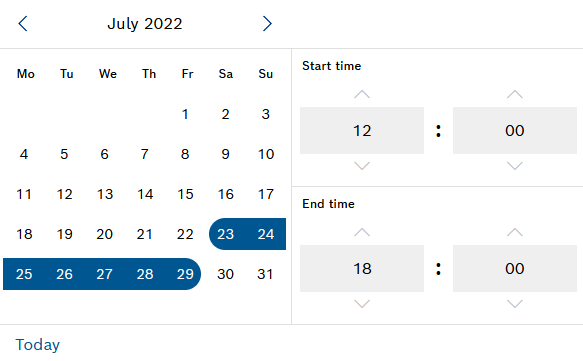
The selected time frame is highlighted in blue.
If you want to view the deviations for the current day, click Today and enter the start and end times.
-
To confirm the input of the time range, click outside of the dialog.
All deviations within the entered time frame are displayed in the table of deviations.
Display deviation details
It is possible to view all deviation data collected by a module and transmitted to the Deviation Processor module, as well as all quick reactions and processing operations for the deviation.
-
Call up the Deviations tab in the Shopfloor management > Deviation processor menu.
-
In the row corresponding to the required deviation, use
 to open the deviation details view.
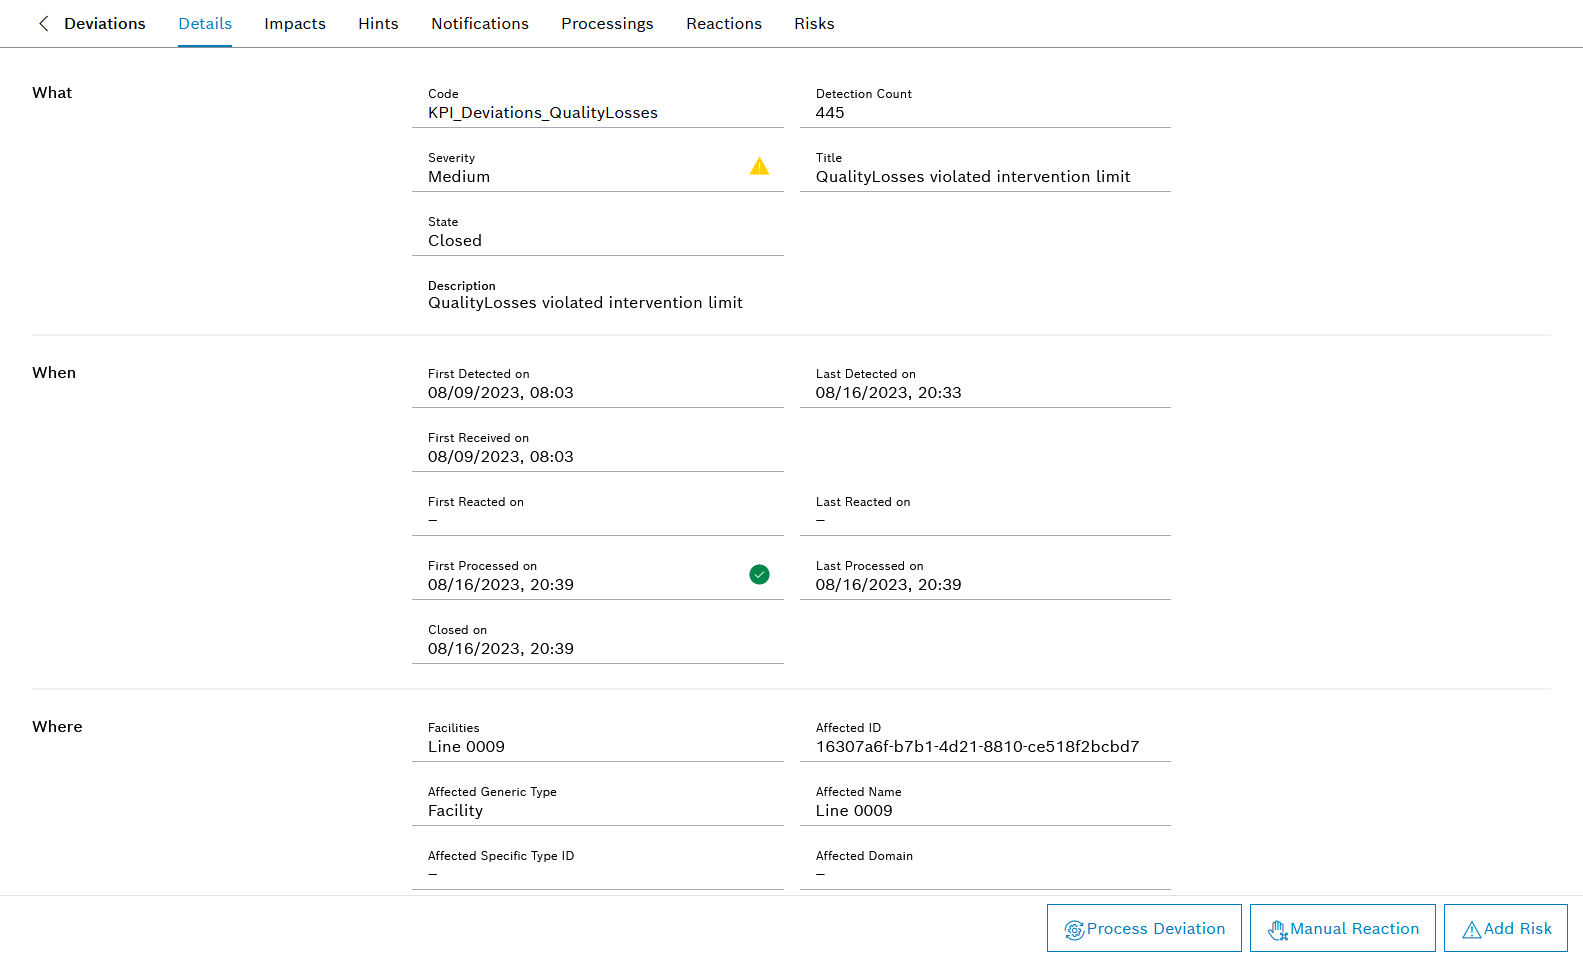
There are seven tabs available in the deviation details view: * Deviations
+ Return to the table of deviations.
-
Details
Default datasets for the deviation:
Description of the deviation
The times, for example, of the first and last message regarding the deviation, or the time at which the deviation was processed
Location of deviation
Module and detectors that sent the deviation
Further Information -
Impacts
Impacts that have occurred due to the deviation
-
Notes
Images or links to assist in processing and resolving the deviation
-
Notifications
List of all detector notifications associated with the deviation
Other current detector notifications that were generated after the deviation occurred and up until its resolutionThe table columns can be set up with
 .
.
Set up table columns -
Processing
Information about how to process and resolve the deviation after a quick reaction or a manual reaction has been triggered
-
Reactions
List of all quick reactions and manual reactions triggered by the deviation
-
Risks
List of all risks created for the deviation
-
Further actions
-
-
To return to the table of deviations, call up the Deviations tab.
All data and processing operations associated with the selected deviation are displayed on the respective tab.
Mark deviation as processed
When a quick reaction or a manual reaction is triggered in the event of a deviation, the information on the deviation is sent to the selected reaction executing system. The deviation is then processed by this module. Once the deviation has been processed, the reaction executing system sends the information on the processing back to Deviation Processor. The deviation concerned is then displayed as processed.
|
Processed deviations may be resolved or may require further processing. |
Individual deviations can be manually marked as processed.
Prerequisite
-
ExpertorAdministratorrole -
At least one deviation has been reported.
Procedure
-
Call up the Deviations tab in the Shopfloor management > Deviation processor menu.
-
Select the row of the deviation to be marked as processed.
-
Select
 Process deviation in the header.
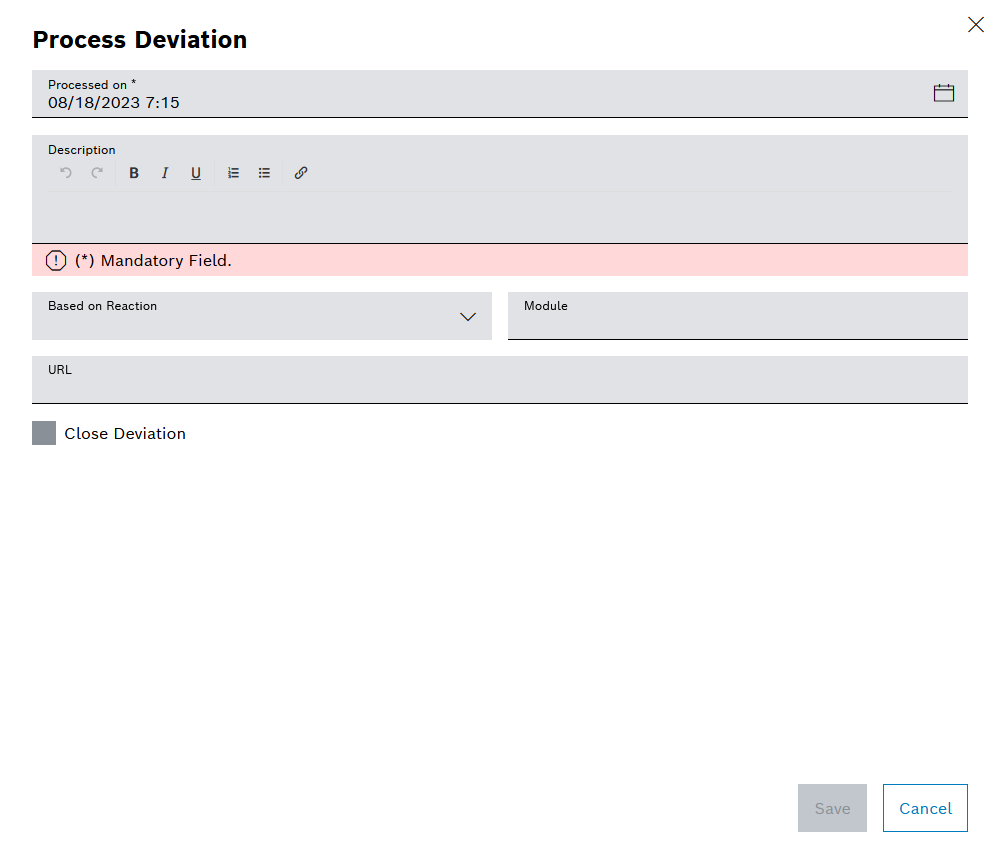
-
To change the processing time, click
in the Processed on input field and select the date and time. -
In the Description text field, enter a description of how the deviation was processed.
-
If necessary, select the quick reaction that was triggered when the deviation occurred from the Quick reactions drop-down list.
The Module input field is automatically filled in when a quick reaction is selected.
-
If necessary, use the Module input field to enter the reaction executing system that received the deviation data via a quick reaction or a manual reaction.
-
If necessary, enter a link in the URL input field to provide additional information.
-
Use Save to mark the deviation as processed.
The deviation is marked as processed. In the table of deviations,  is displayed in the Processed column in the row of the deviation.
|
|

-
To display details about a deviation, continue with Display deviation details.
Trigger manual reaction
Manual reactions can be triggered for individual deviations.
Prerequisites
-
ExpertorAdministratorrole -
At least one deviation has been reported.
Procedure
-
Call up the Deviations tab in the Shopfloor management > Deviation processor menu.
-
Select the row of the deviation for which a manual reaction should be triggered.
-
Select
 Manual reaction in the header.
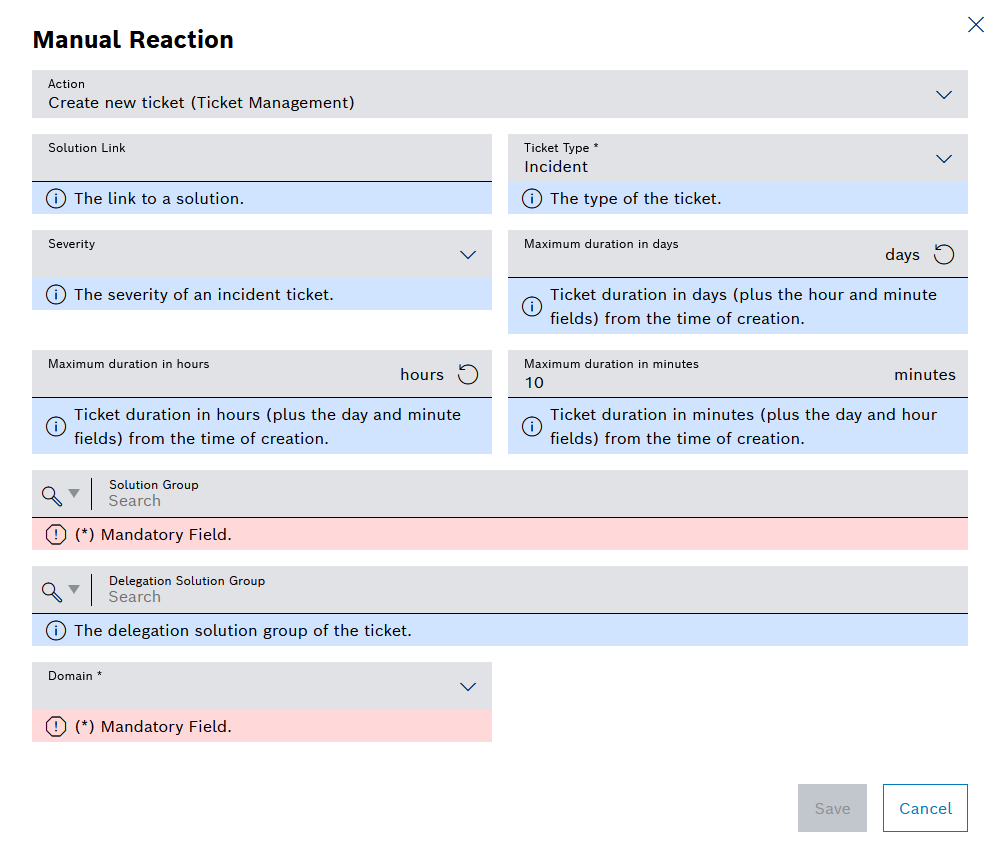
In the Manual Reaction dialog, specify an action to be performed when the reaction is triggered. Under the action, fields are listed with the specific information to be sent to the reaction executing system during the action.
-
Select the action to be performed from the Action drop-down list.
-
Under the Action drop-down list, enter the information values to be sent when the reaction is triggered.
-
Press Save to trigger the manual reaction.
The manual reaction has been triggered for the deviation and the selected action has been performed. In the deviation details, the action is displayed on the Reactions tab.
-
To display the deviation details, continue with Display deviation details.
Add risk
Risks can be added to individual deviations.
Requirements
-
ExpertorAdministratorrole -
At least one deviation has been reported.
Procedure
-
Call up the Deviations tab in the Shopfloor management > Deviation processor menu.
-
Select the row of the deviation for which a risk should be added.
-
Select
 Add risk in the header.
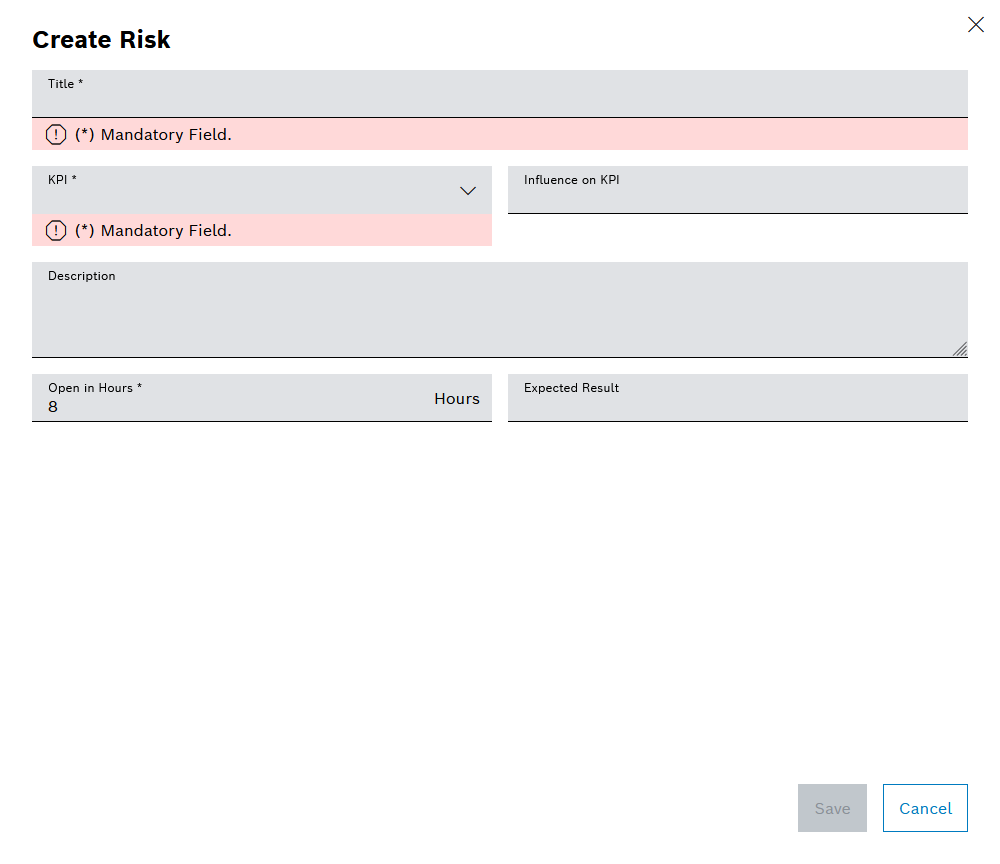
-
In the Create risk dialog, complete the following fields:
-
Title
Name of the risk
-
KPI
KPI category influenced by the risk
-
Influence on KPI
Value that indicates the extent to which the selected KPI category is affected
-
Description
Information about the risk
-
Open in hours
Value in hours after which the risk is automatically closed
-
Expected result
Expected improvement if the risk is closed in time
-