View configuration
Select Performance analysis, choose a device and click on View Configuration. This view enables to define own views used in Live or Measurements tab. It is possible to define Aggregation Type and Level, displayed Measurements in defined color, min and max values, and chart types. It is possible to add multiple axis. The views are created for a device type and apply to all devices related.
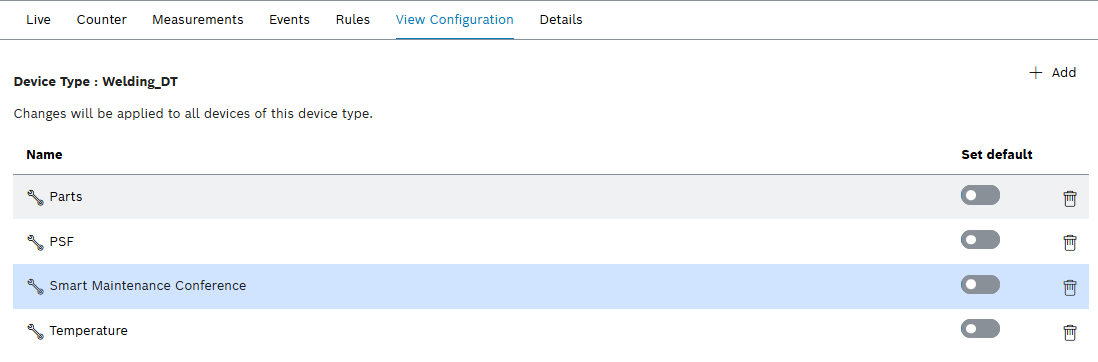
Overview
Here are all created views displayed there applicable for the selected device, based on the given device type. It is possible to add, edit or delete views. One view can be defined as default view for Live and Measurements tab. With click on one view, the edit overlay will open.
| Element | Description | ||
|---|---|---|---|
|
Add a view. |
||
Name |
Name of the view |
||
Set as default |
Define the view as the default. Only one view can be set as the default view. If a default view is enabled, it is automatically preselected in the Live and Measured Values tabs.
|
||
|
Delete view. |


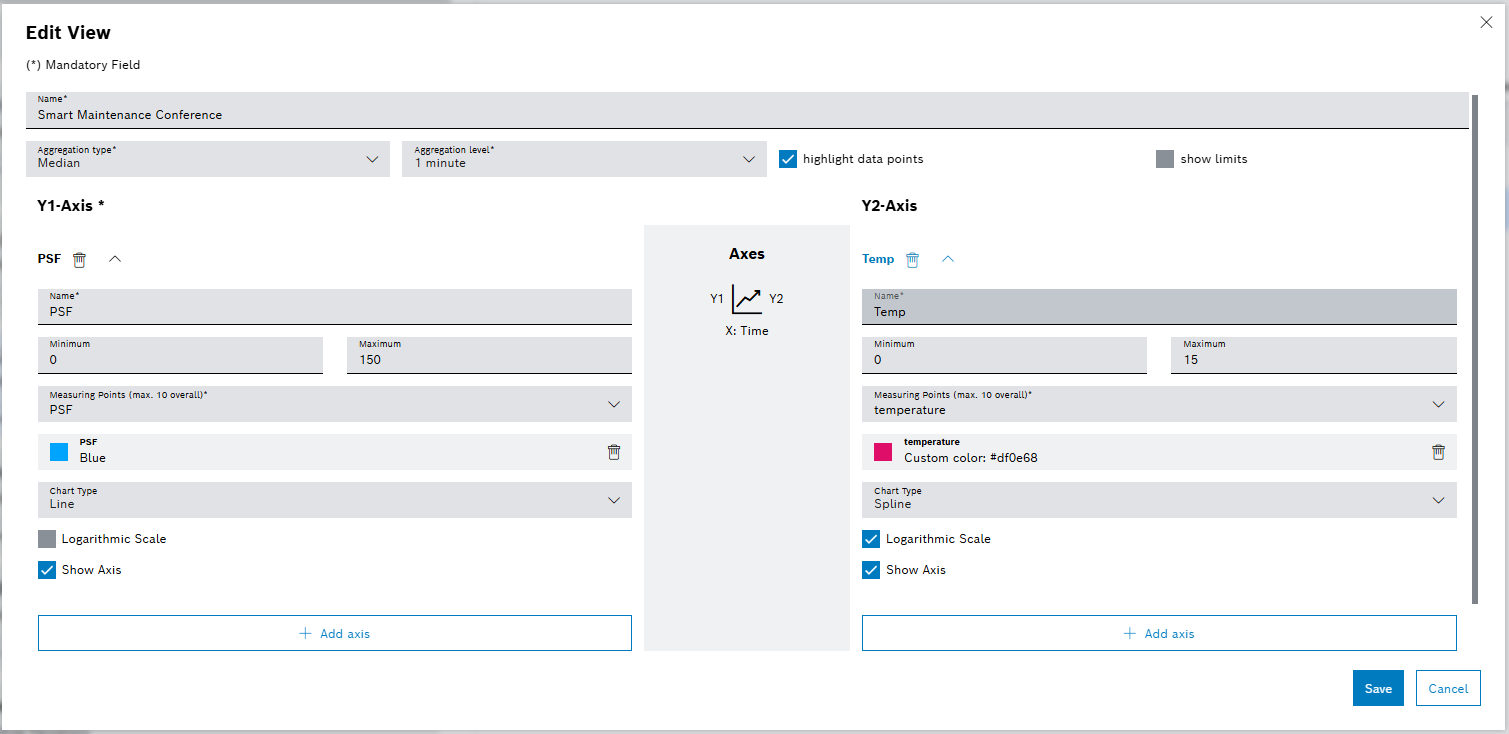
Create / Edit view
In this overlay, all details of the custom view configuration can be setup.
| Element | Description | ||
|---|---|---|---|
Name |
Assign the name of the view. |
||
Aggregation type & Aggregation Level |
Define aggregation type and level in the same ways as is Measurements tab. See: Configure aggregation settings.
|
||
Highlight data points |
Highlight data points in the view in the Live and Measured Values tabs. |
||
show limits |
Display machine limit values. |
||
|
Add Y axis on the right or left side |
Y1 axis/Y2 axis
| Element | Description | ||
|---|---|---|---|
|
Delete Axis. |
||
Name |
Name of the axis. |
||
Minimum |
Define the smallest value for the axis. |
||
Maximum |
Define the largest value for the axis. |
||
Measurement point |
Searchable multiselect to define the measurements displayed on this axis. |
||
|
Use preselected color to highlight the measuring point in the chart view. Or use the pickerel to select another color. Click on the measurement, choose one of the preset colors, or define a custom color. Click on |
||
Chart type |
Select between different visualization types for the measurements. Scatter Display measurement data in a point cloud. Spline Display measuring points in a line diagram with curves. Line Display measuring points in a line diagram with lines. Column Display measurement data in a bar chart. Area Display measurement data in an area chart. Step Display measurement data in a line diagram with lines that go up or down in steps. |
||
Logarithmic scale |
Use logarithmic scales.
|
||
Axis visible |
Show or hide axis |