Overview: Comparison tab
Under Shopfloor management > Global production overview on the Comparison tab, the key performance indicators of production units are compared with one another.
There are two areas on the Comparison tab: The comparison itself, and the filter, which can be used to show and hide production units for comparison.
The comparison can be represented in three ways:
-
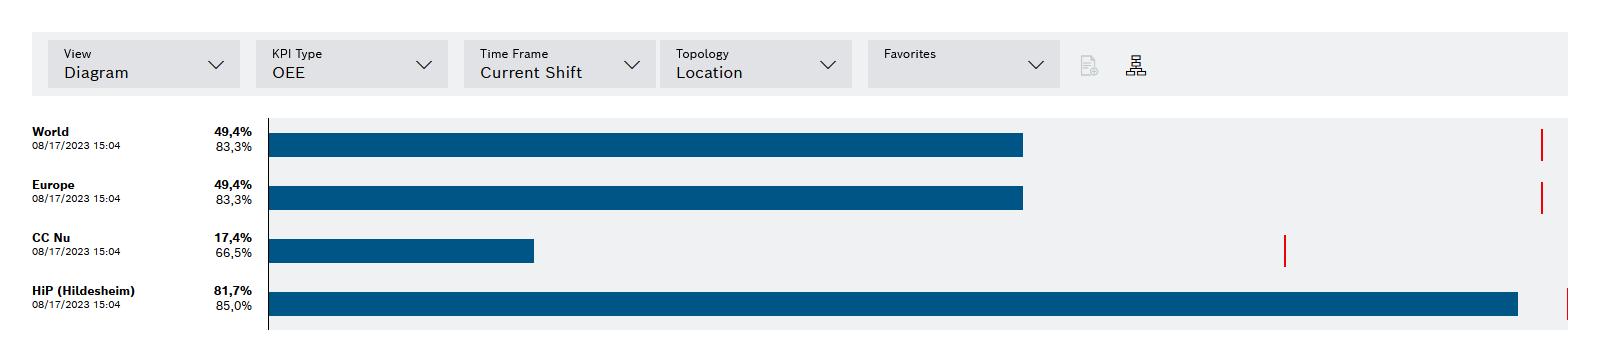
Diagram
Displays a selectable KPI value in a bar chart -
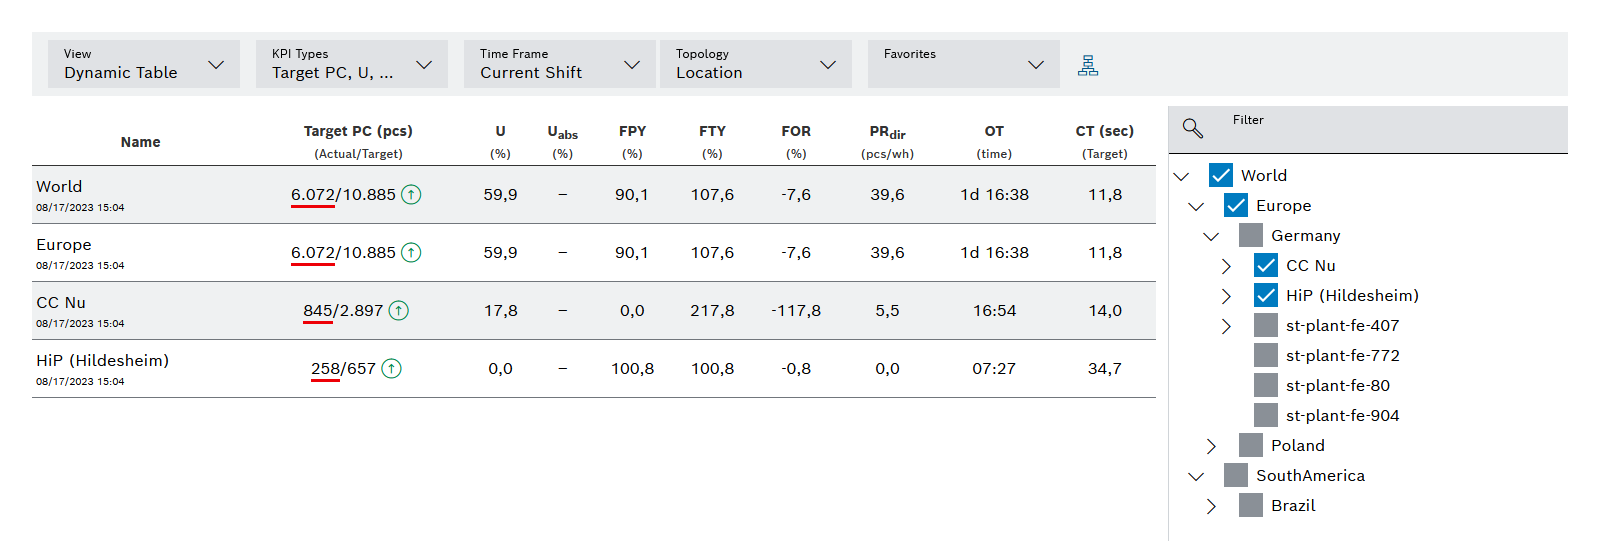
Dynamic composition
Displays the key performance indicators for any number of selectable KPI types in a list -
Static composition
Displays the key performed indicators of predefined KPI values in a list
Diagram
| Element/icon | Description | ||
|---|---|---|---|
Presentation |
Select chart. |
||
KPI type |
Select a key performance indicator type. |
||
Time Frame |
Select the time segment to use for the comparison. |
||
Topology |
Select whether to display locations or business units. |
||
Favorites |
Select favorites group. |
||
|
Show or hide the hierarchy tree. Blue = shown |
||
|
Show or hide the total row. The sum of the KPI value (e.g. quantities) is shown as a bar below all selected lines. Blue = enabled
|
||
|
Actual value display |
||
|
Setpoint display |

Dynamic composition
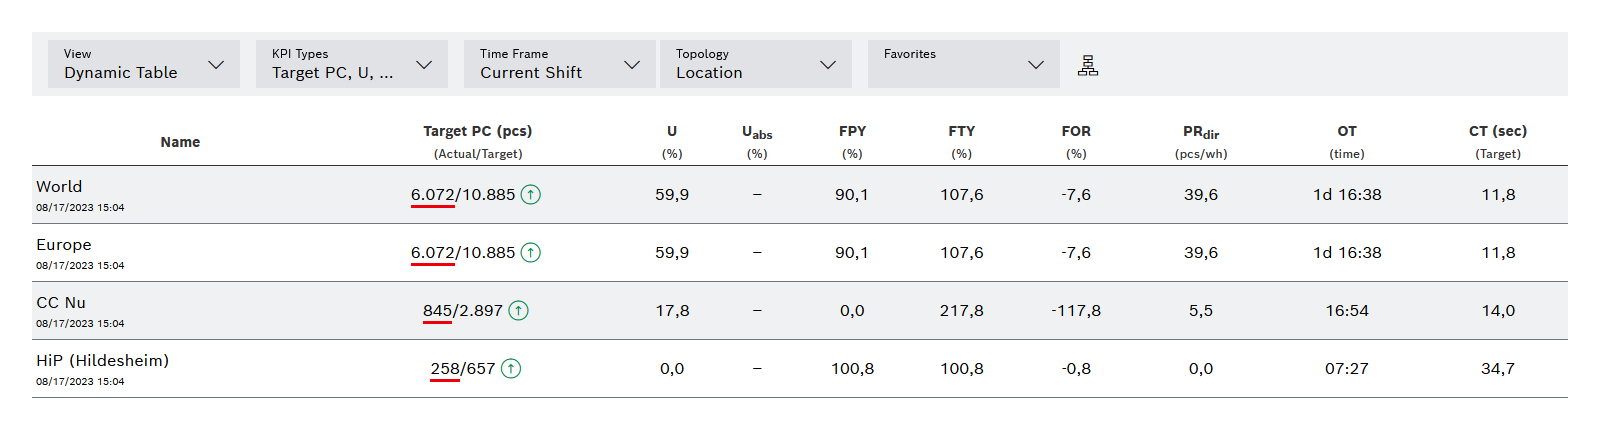
| Element/icon | Description |
|---|---|
Presentation |
Select Dynamic Composition. |
KPI types |
Select all key performance indicator types to be displayed. |
Time Frame |
Select the time segment to use for the comparison. |
Topology |
Select whether to display locations or business units. |
Favorites |
Select favorites group. |
|
Show or hide the hierarchy tree. Blue = shown |
|
Display of the trend for the OEE and PC key figures in the current shift:
|
Colored line below the actual values |
Status display for the key performance indicators OEE and PC:
|
Static composition
| Element/icon | Description |
|---|---|
Presentation |
Select Static Composition. |
Topology |
Select whether to display locations or business units. |
Favorites |
Select favorites group. |
|
Show or hide the hierarchy tree. Blue = shown |
Filter
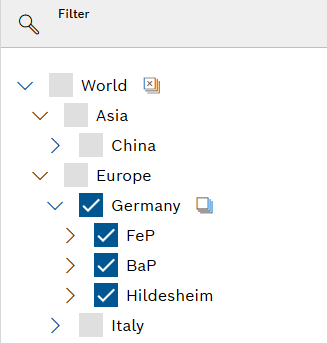
| Element/icon | Description |
|---|---|
|
Search for the production unit in the filter. |
|
Deselect all production units for comparison. |
|
Select all subordinate production units for comparison. |
|
Deselect all subordinate production units for comparison. |

Compare production units
Production units can be shown and hidden to compare them directly with each other.
-
Open the Shopfloor Management > Global Production Overview > Comparison menu entry.
-
Select the desired Representation.
Overview: Comparison tab -
Select KPI types, time range and topology as required.
The selected KPI values are displayed.
-
If the hierarchy tree is hidden, show it using Hierarchy
 .
. -
In the hierarchy tree, use the Next
 button to open the desired hierarchy level.
 -
Click on the entries for which the data is to be displayed.
Several production units can be selected or deselected using the following buttons:
Select all children
Deselect all children
Deselect all
The production units and the associated data are displayed in the comparison. In the hierarchy tree, the Checkbox  indicates that the production unit is selected for comparison.
Compare favorites groups
Prerequisite
Favorites are assigned to a favorites group.
Assign and remove favorites to/from a favorites group
Procedure
-
Open the Shopfloor Management > Global Production Overview > Comparison menu entry.
-
Select the desired Representation.
Overview: Comparison tab -
Select KPI types, time range and topology as required.
-
In the Favorites drop-down list, select the desired favorites group.
The data from the production units of the selected favorites group is displayed in the comparison.
Show a KPI value for multiple time ranges
Individual KPI values in the available time ranges can be shown in the rows of production units for comparison.
-
Open the Shopfloor Management > Global Production Overview > Comparison menu entry.
-
Select the desired Representation.
-
Select KPI types , Time range , Topology and Favorites as required.
-
Show a comparison with the production unit whose KPI values are to be shown in the available time ranges.
Compare production units -
Click the desired production KPI value for the production unit.
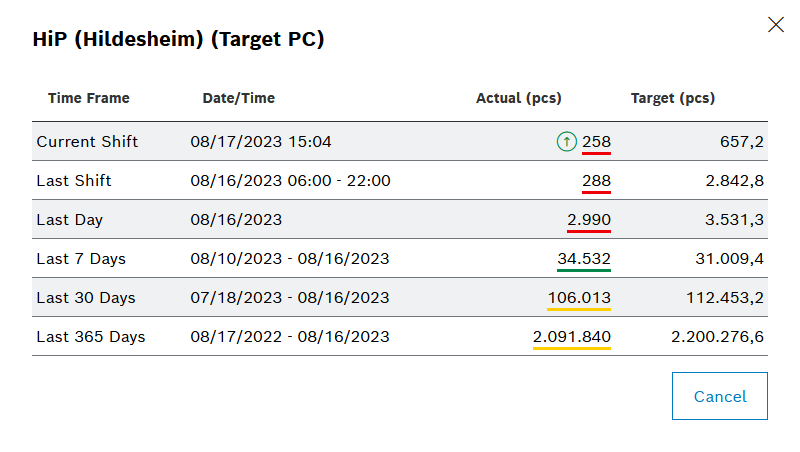
The window <Produktionseinheit> (<KPI-Wert>) shows the selected KPI value in the available time ranges.
Target values and trends are also specified for the key performance indicators OEE and PC.
Access a link from the Comparison tab
On the Comparison tab, links to other systems on the network can be accessed for a production unit.
Prerequisite
At least one link is configured for the production unit.
Static links tab
Generic links tab
Procedure
-
Open the Shopfloor Management > Global Production Overview > Comparison menu entry.
-
Select the desired Representation.
-
Select KPI types , Time range , Topology and Favorites as required.
-
Filter a comparison with the production unit whose link you want to access.
Compare production units -
Click on the name of the production unit.

In the Links for: window, <Produktionseinheit> all of the links configured for this production unit are shown.
-
In the Links for: window, <Produktionseinheit> click the desired link.
A window opens in the web browser containing the page associated with the link.