Part Count Chart
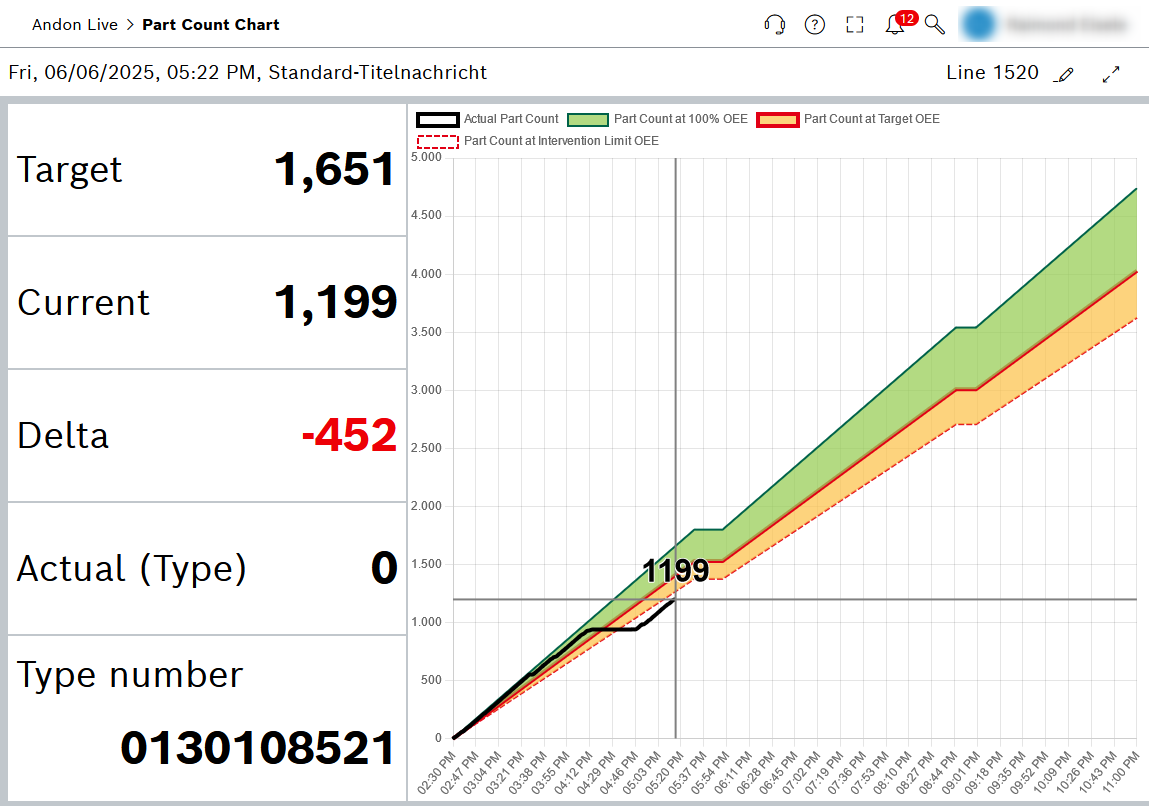
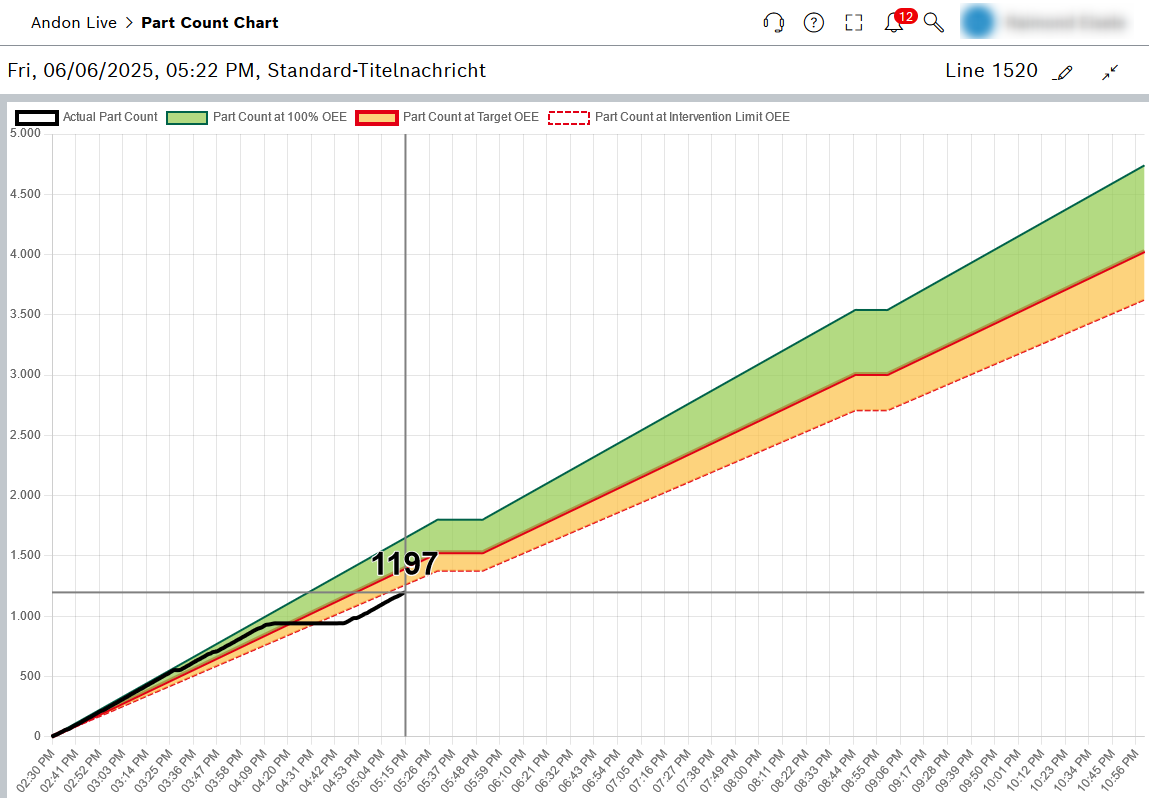
The Part Count Chart view displays the production data of the current shift graphically. By default the screen is spilt into two main parts. The left-hand area shows the production data for the selected line, while the right-hand area displays a diagram of the production process. The diagram can be maximized to the full size of the screen by clicking on the Maximize icon in the header.
Header
| Element | Description |
|---|---|
Ostfildern plant |
Title message: Add, edit terminal |
Line xyz |
The production line selected in the Select Line drop-down list |
|
Select the production line and station using the drop-down lists |
|
Maximize or minimize the chart area of the view |


Production data
The production data for the selected line and station is displayed in the left-hand area.
Diagram
Graphical representation of the production process. The following production data is displayed:
-
Continuous red line: Part count at OEE set value.
-
Continuous green line: Part count at 100% OEE.
-
Broken red line: Quantity at OEE control limit.
-
Black line: Actual quantity of parts.
-
Green area: Part count range between 100% OEE and OEE set value.
-
Yellow area: Part count range between OEE set value and the OEE action limit.
-
Gray vertical line: Shows the current time.
Mouseover function : Detailed information is displayed.