SOT
    • Introduction
    • User manual
      • Description of the interaction elements
        • Additional actions
        • Extended search
        • Adjusting diagram zoom level
        • Adjust display mode
      • General key figures reports
        • OEE
        • Utilization rate
        • Productivity
      • Part count reports
        • Part count and loss processes
        • Accumulated part count
        • Yield and fall off rate
      • Interruptions reports
        • Downtimes
        • Station error
        • 4M downtimes
      • Changeovers reports
      • Cycle times reports
        • Cycle times
        • Cycle time trend
      • Equipment analysis reports
        • Equipment state distribution
        • Availability and reliability
        • Facility events
    • Operations manual
    • API documentation
    • Glossary
KPI Reporting
  • Smart Operations Toolkit
    • Deviation Processor
    • Multitenant Access Control
    • Notification Service
    • Ticket Management
    • Web Portal
  • Shopfloor Management
    • Andon Live
    • KPI Reporting
    • Operational Routines
    • Shift Book
    • Shopfloor Management Administration
  • Product & Quality
    • Process Quality
    • AI Services
  • Machine & Equipment
    • Condition Monitoring
    • Device Portal
  • Enterprise & Shopfloor Integration
    • Information Router
    • Master Data Management

SOT Learning Portal

  • KPI Reporting
  • User manual
  • Description of the interaction elements
  • Adjust display mode

Adjust display mode

Different display modes are available depending on the report:

  • Diagram

  • Table

  • Raw data

Prerequisite

KPI Reporting: User or KPI Reporting: Admin role

Procedure

  1. Click watch-on.

  2. Select a display mode from the drop-down list.

The display mode is adjusted according to the selection.

Diagram display mode

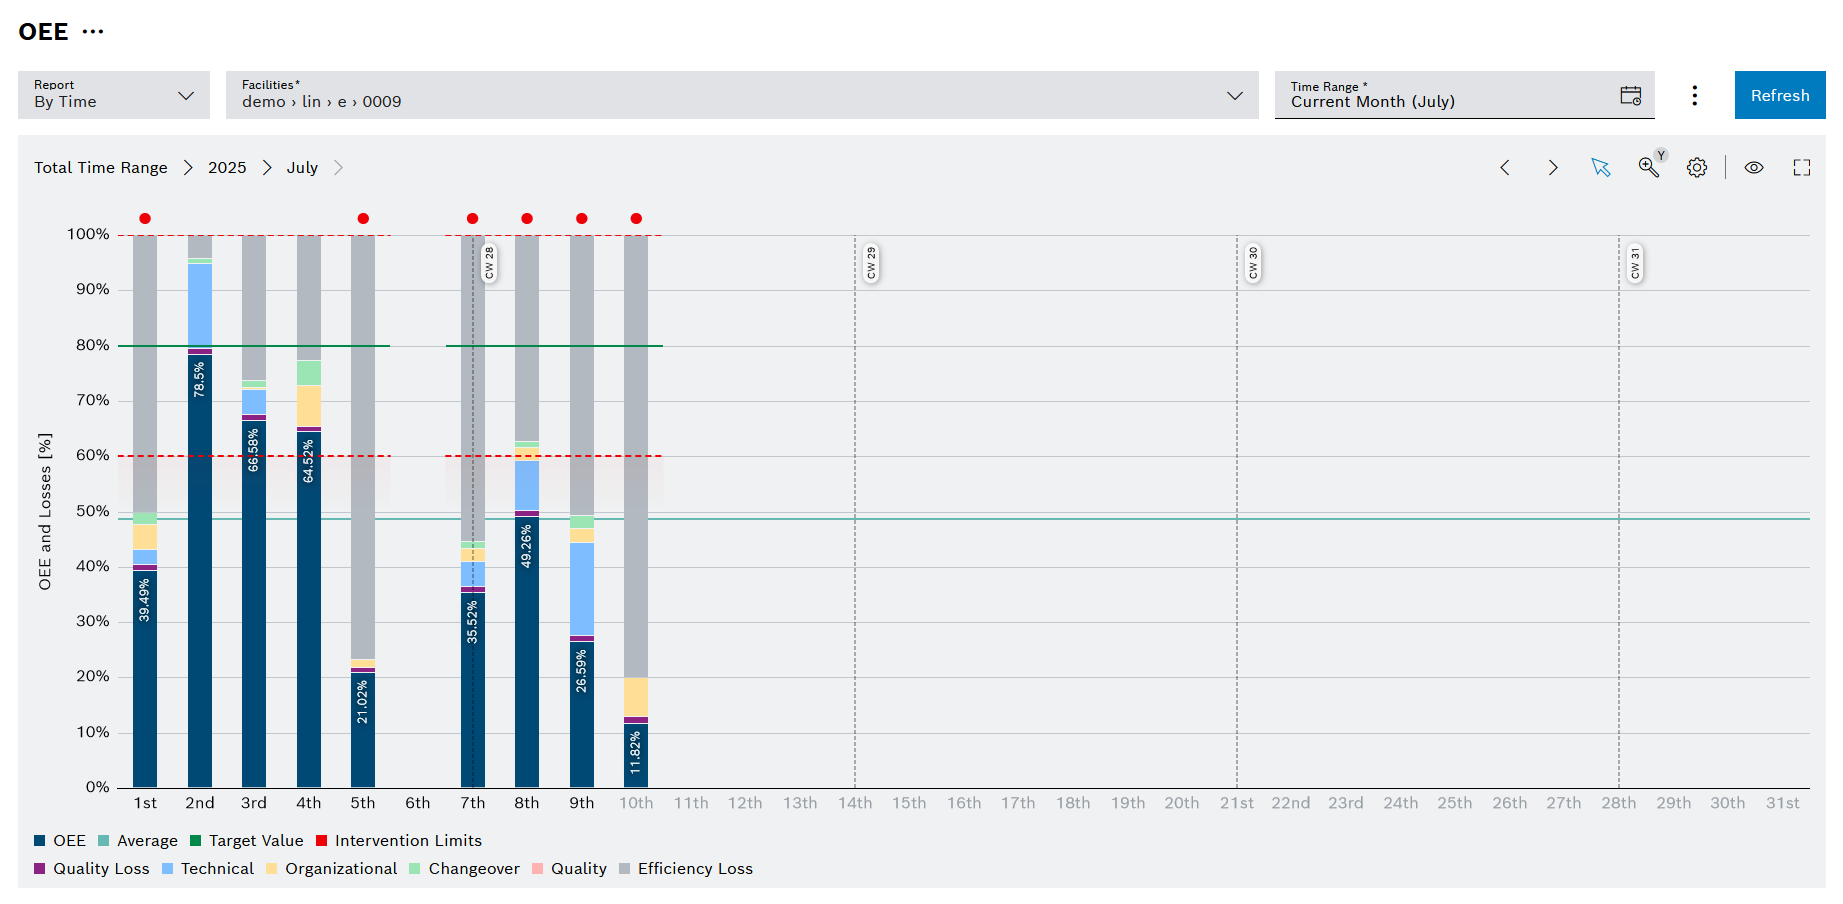
The Diagram display mode shows the reports in a diagram.
kpi_chart_view
Element Description

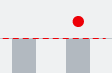
kpi_chart_view_intervention_limit_indicator

Indicator in red shows values outside intervention limit(s).

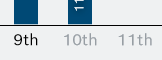
kpi_chart_view_x_Axis_future_labels

The current time span and time spans in future are shown in gray color. Time spans in the future will show no target values or intervention limits.

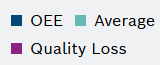
kpi_chart_view_legend

Click on legend color indicator to show/ hide the corresponding value category.

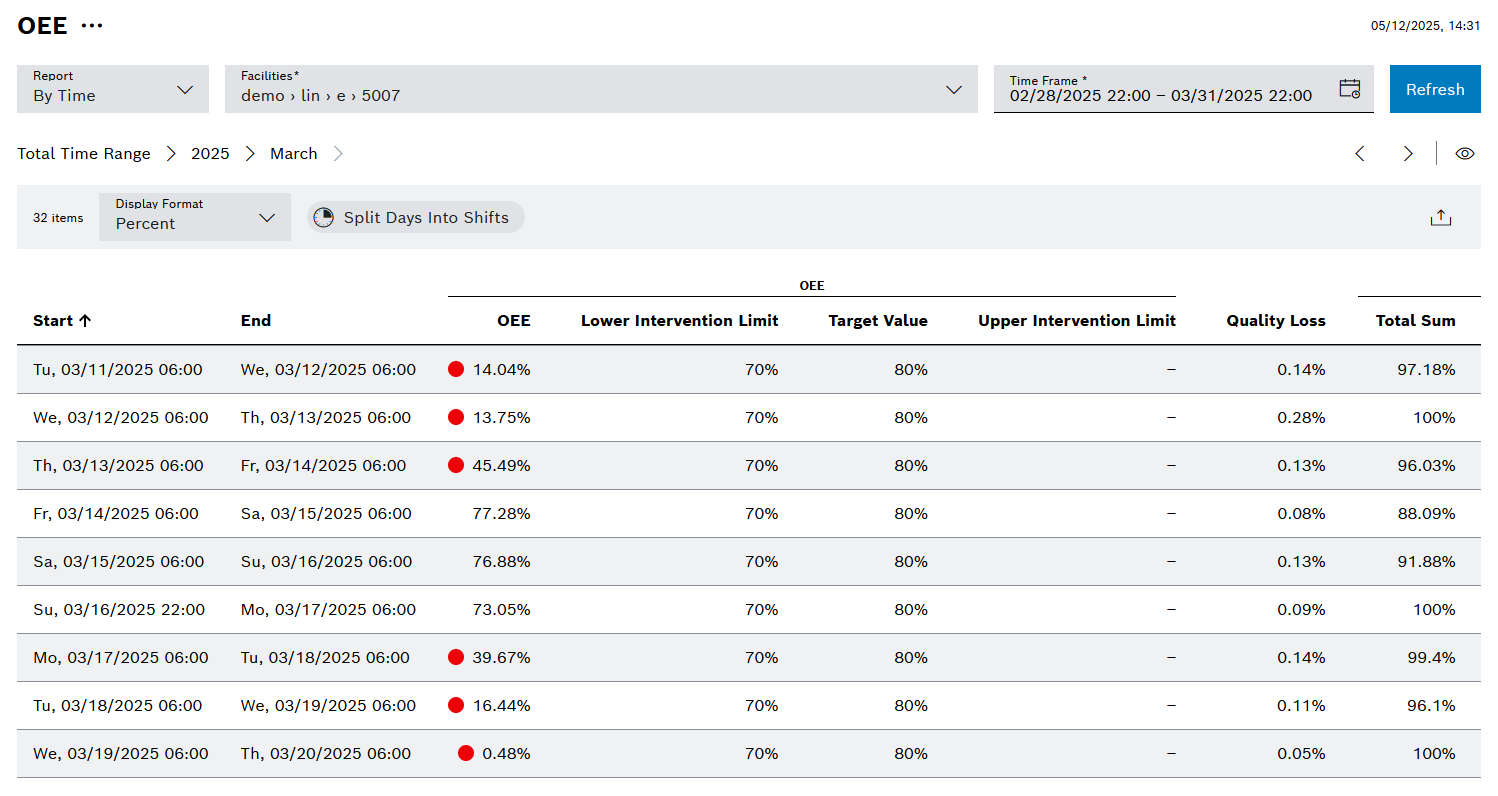
Table display mode

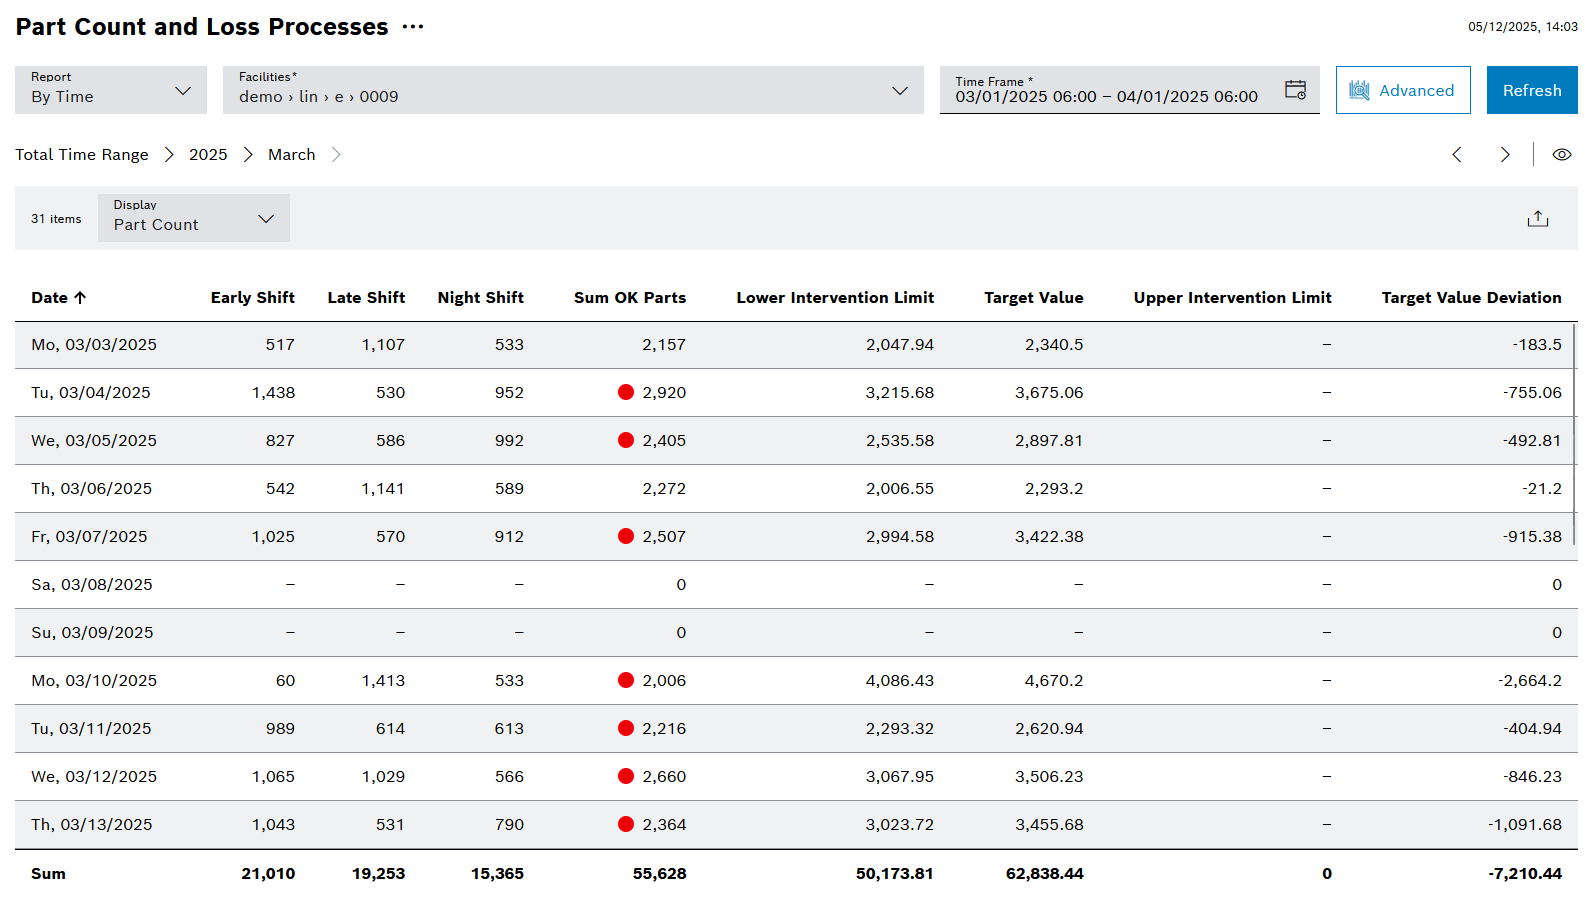
The Table display mode shows the reports in tabular form. The data can be exported in CSV format.

kpi_table_view

Raw data display mode

The Raw data display mode shows the source data of a report in tabular form. Raw data is displayed broken down by shift. The data can be exported in CSV format.

kpi_details_view

Contents

© Robert Bosch Manufacturing Solutions GmbH 2023-2026, all rights reserved

Changelog Corporate information Legal notice Data protection notice Third party licenses