Logging and monitoring
The services log to std:out. Monitoring solutions as e.g. Elasticsearch and Kibana (ELK) can be attached, ELK agent is available in the images.
The logging can be enabled as described for the individual images in Setup and configuration.
Monitoring UI
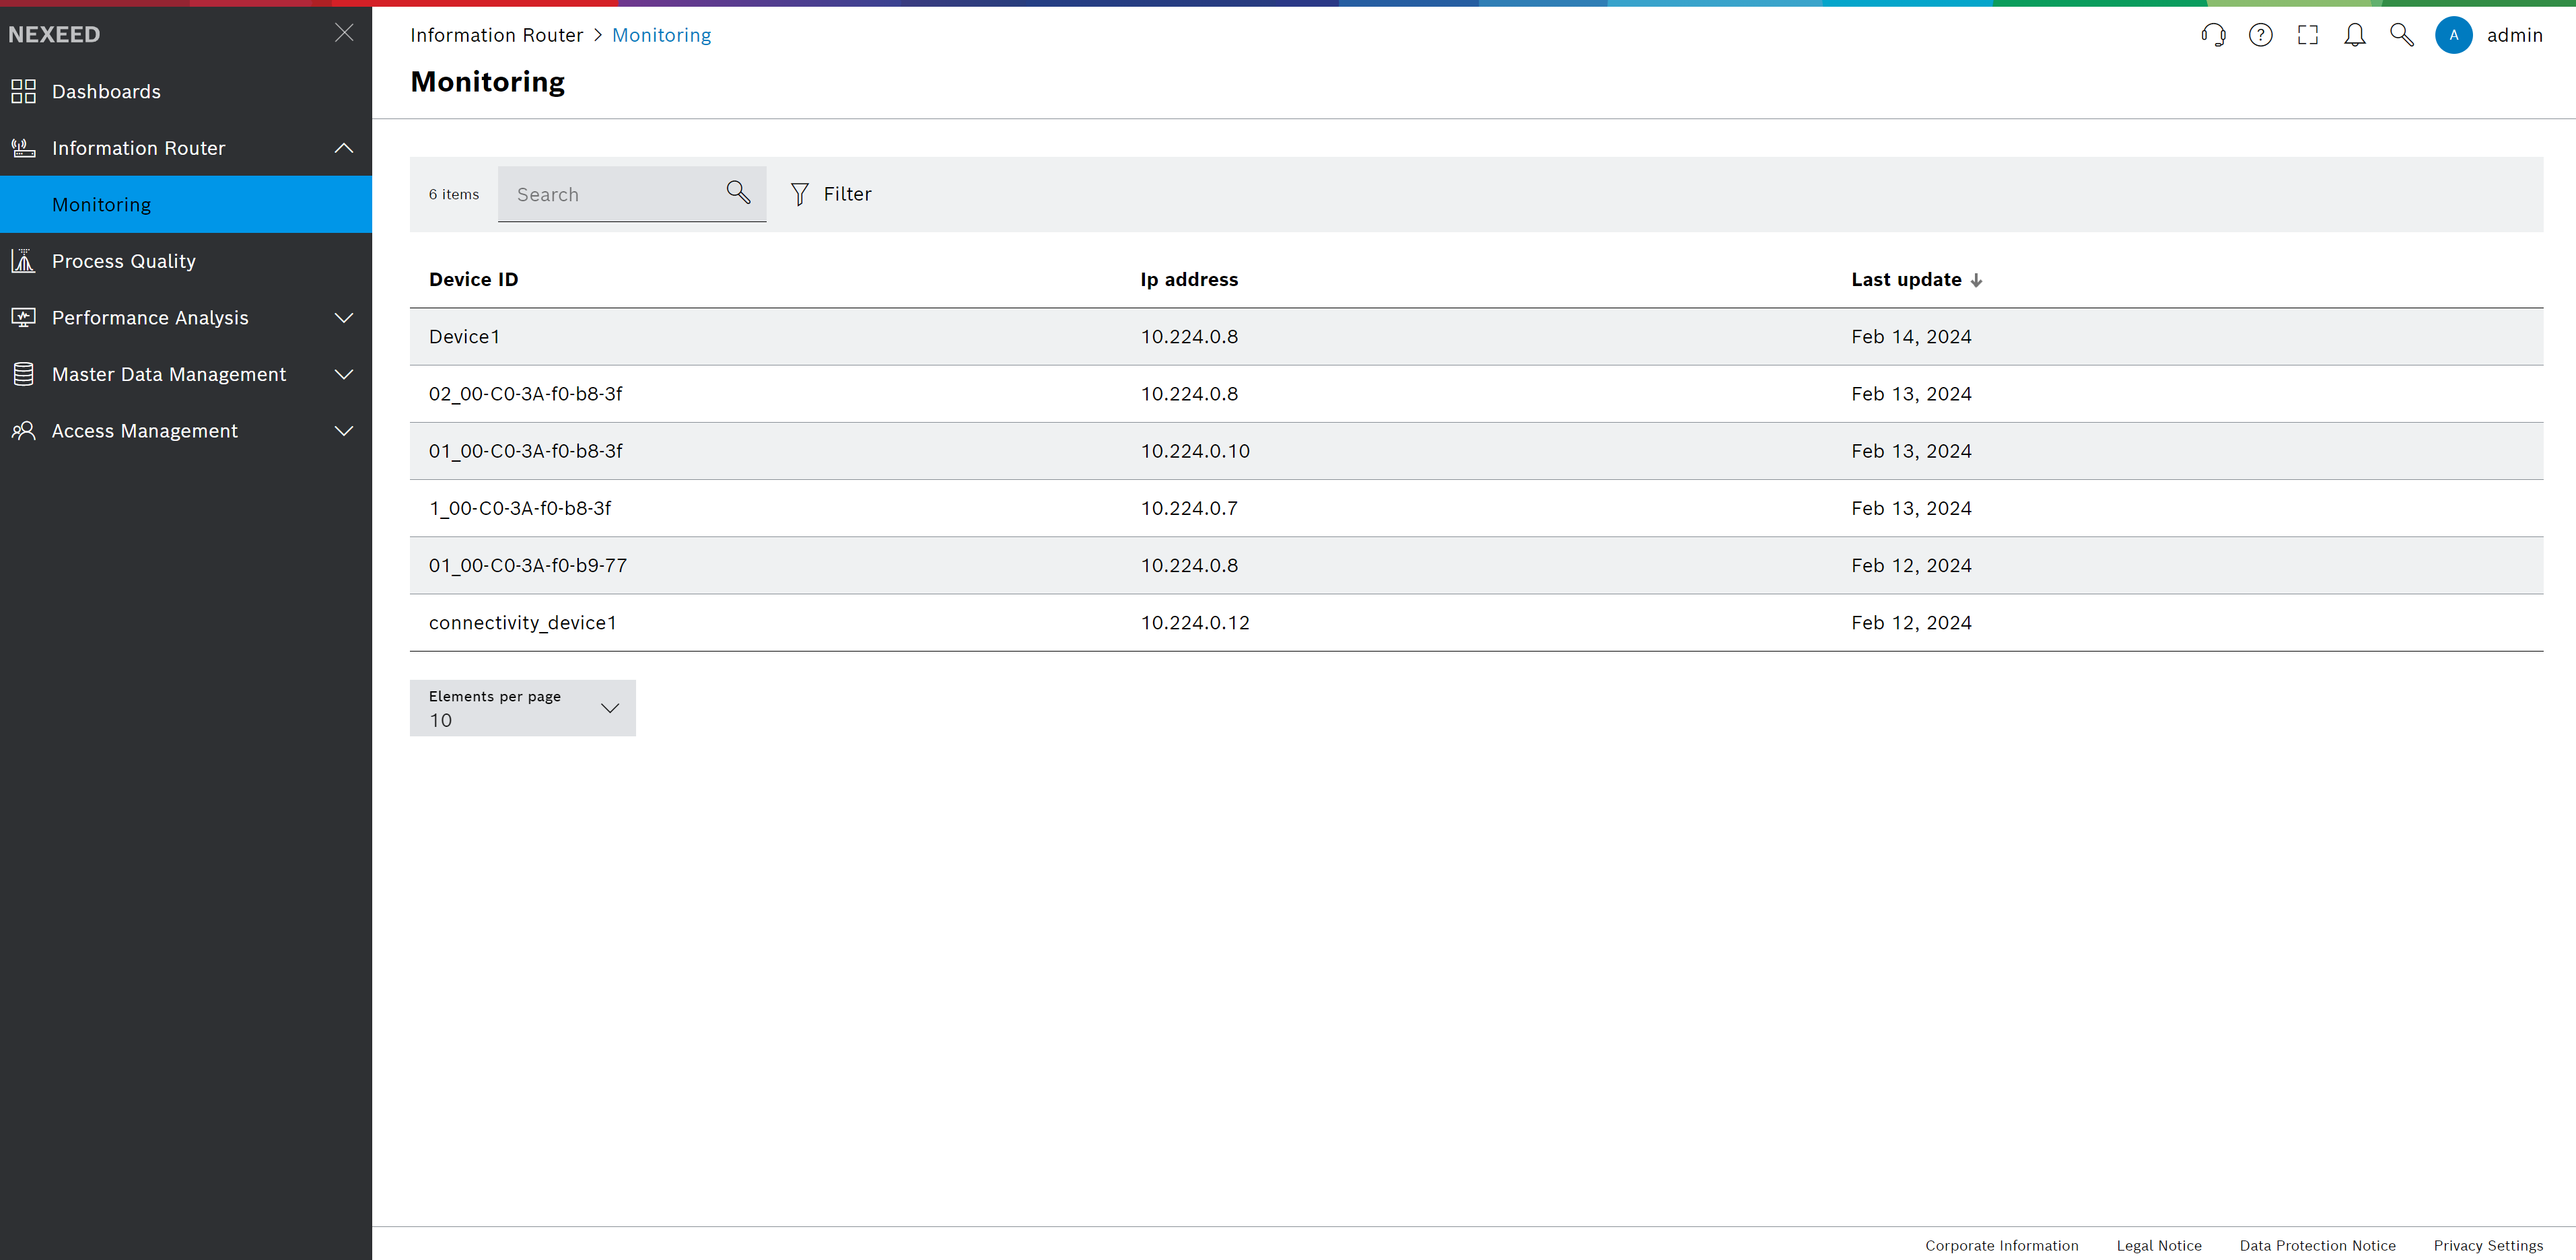
The Monitoring UI in the Web Portal can be found in > Information Router > Monitoring. It provides an overview of devices, which sent messages to the Information Router.
By default the message forwarding from Information Router is disabled. To enable and configure the ui see Setup and configuration.
With the search field at the top, devices can be filtered by Device ID. An IP Address filter can be accessed through the filter button right of the search field. Clicking any of the table headers wil sort the table in ascending or descending order for the respective column.
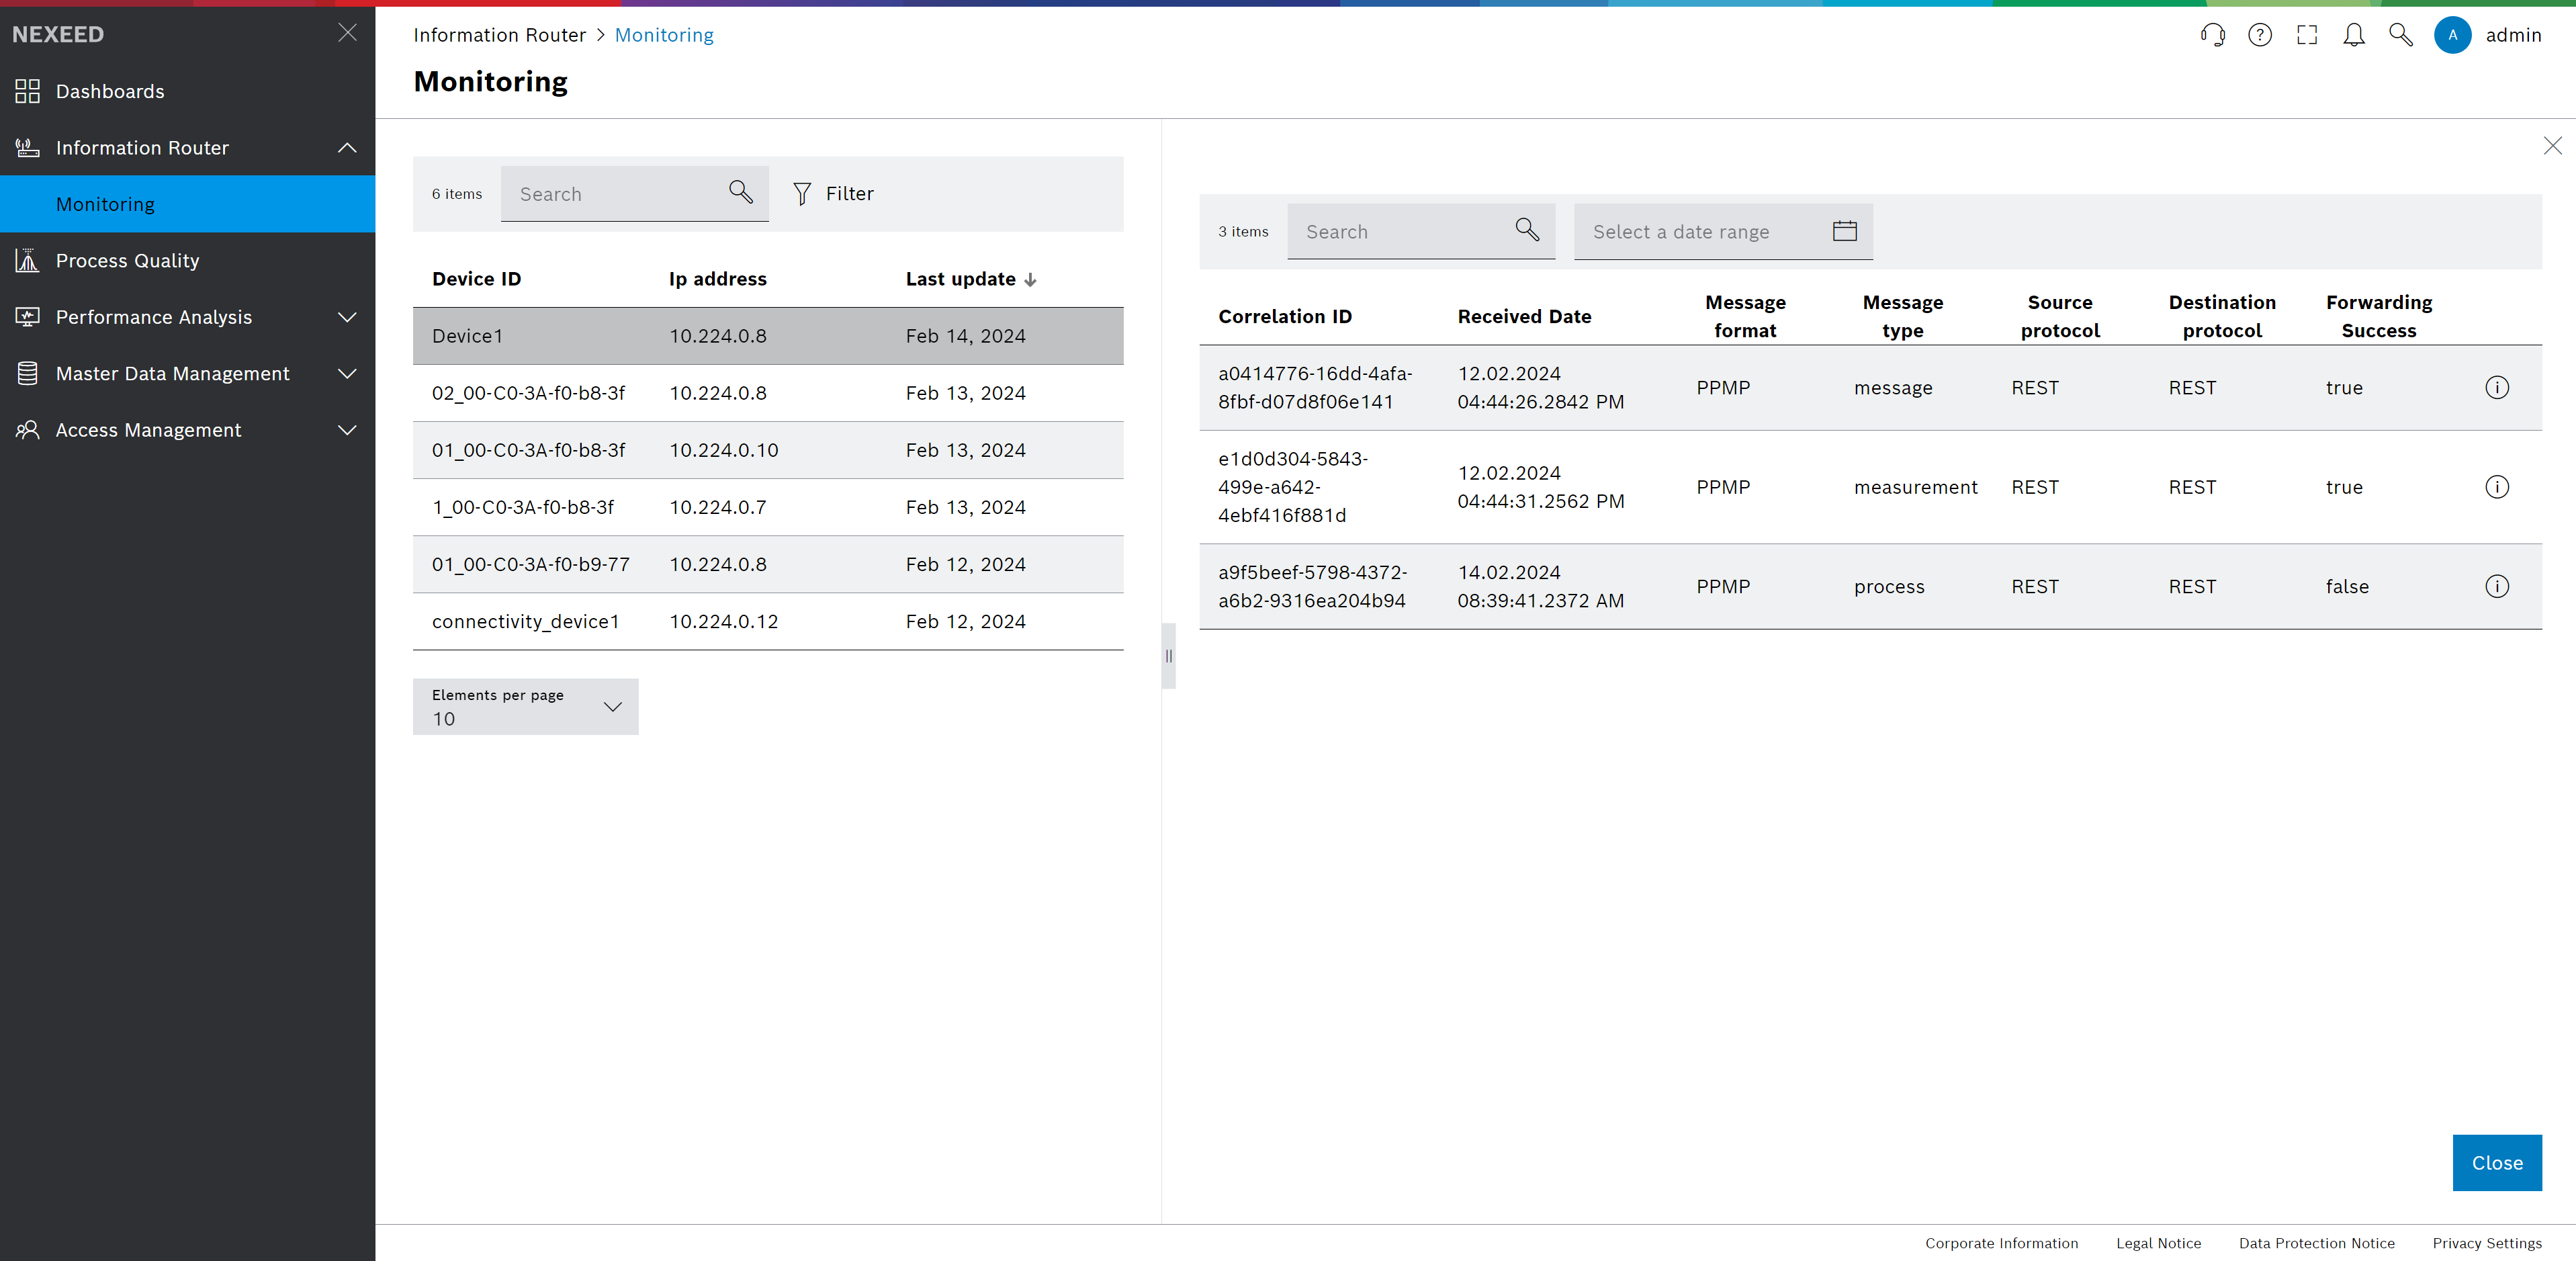
Clicking on a device shows the messages sent by the device.
With the search field at the top, messages can be filtered by Correlation ID, Message format, Message type, Source protocol, Destination protocol and content of received and sent message. The date range can be filtered with the date picker besides the search field.
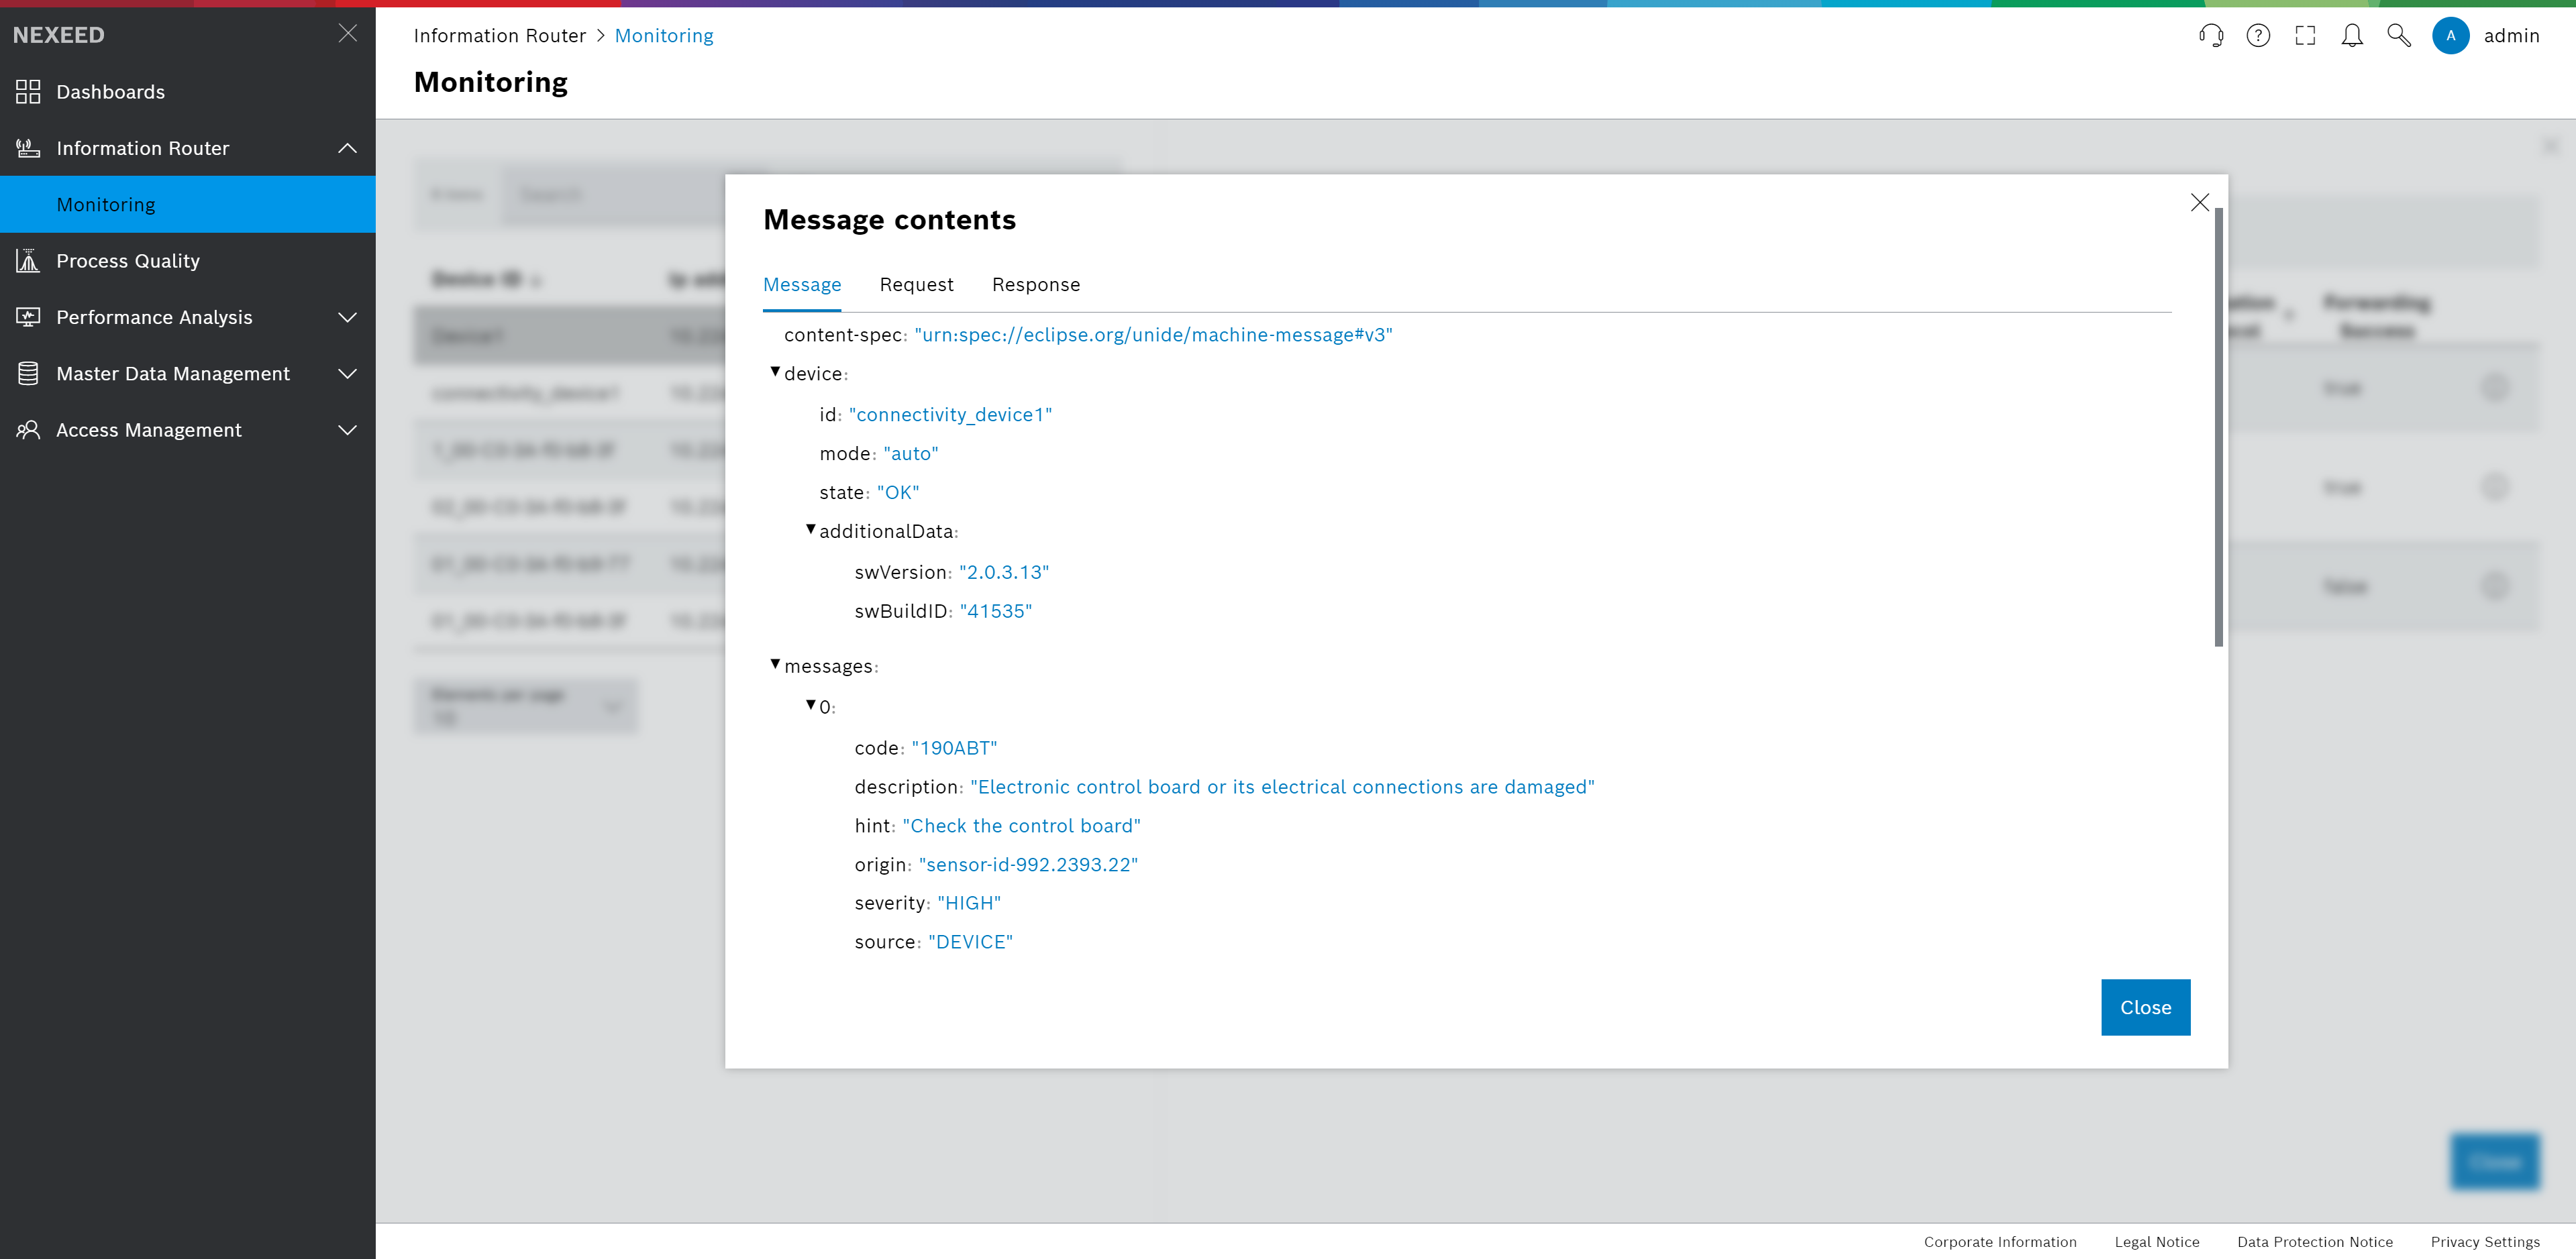
Clicking on a message shows the payload sent by the device (Message tab), the payload information router forwarded (Request tab) and either the response (Response tab) from the forwarded request or the error message created during forwarding (Error tab).
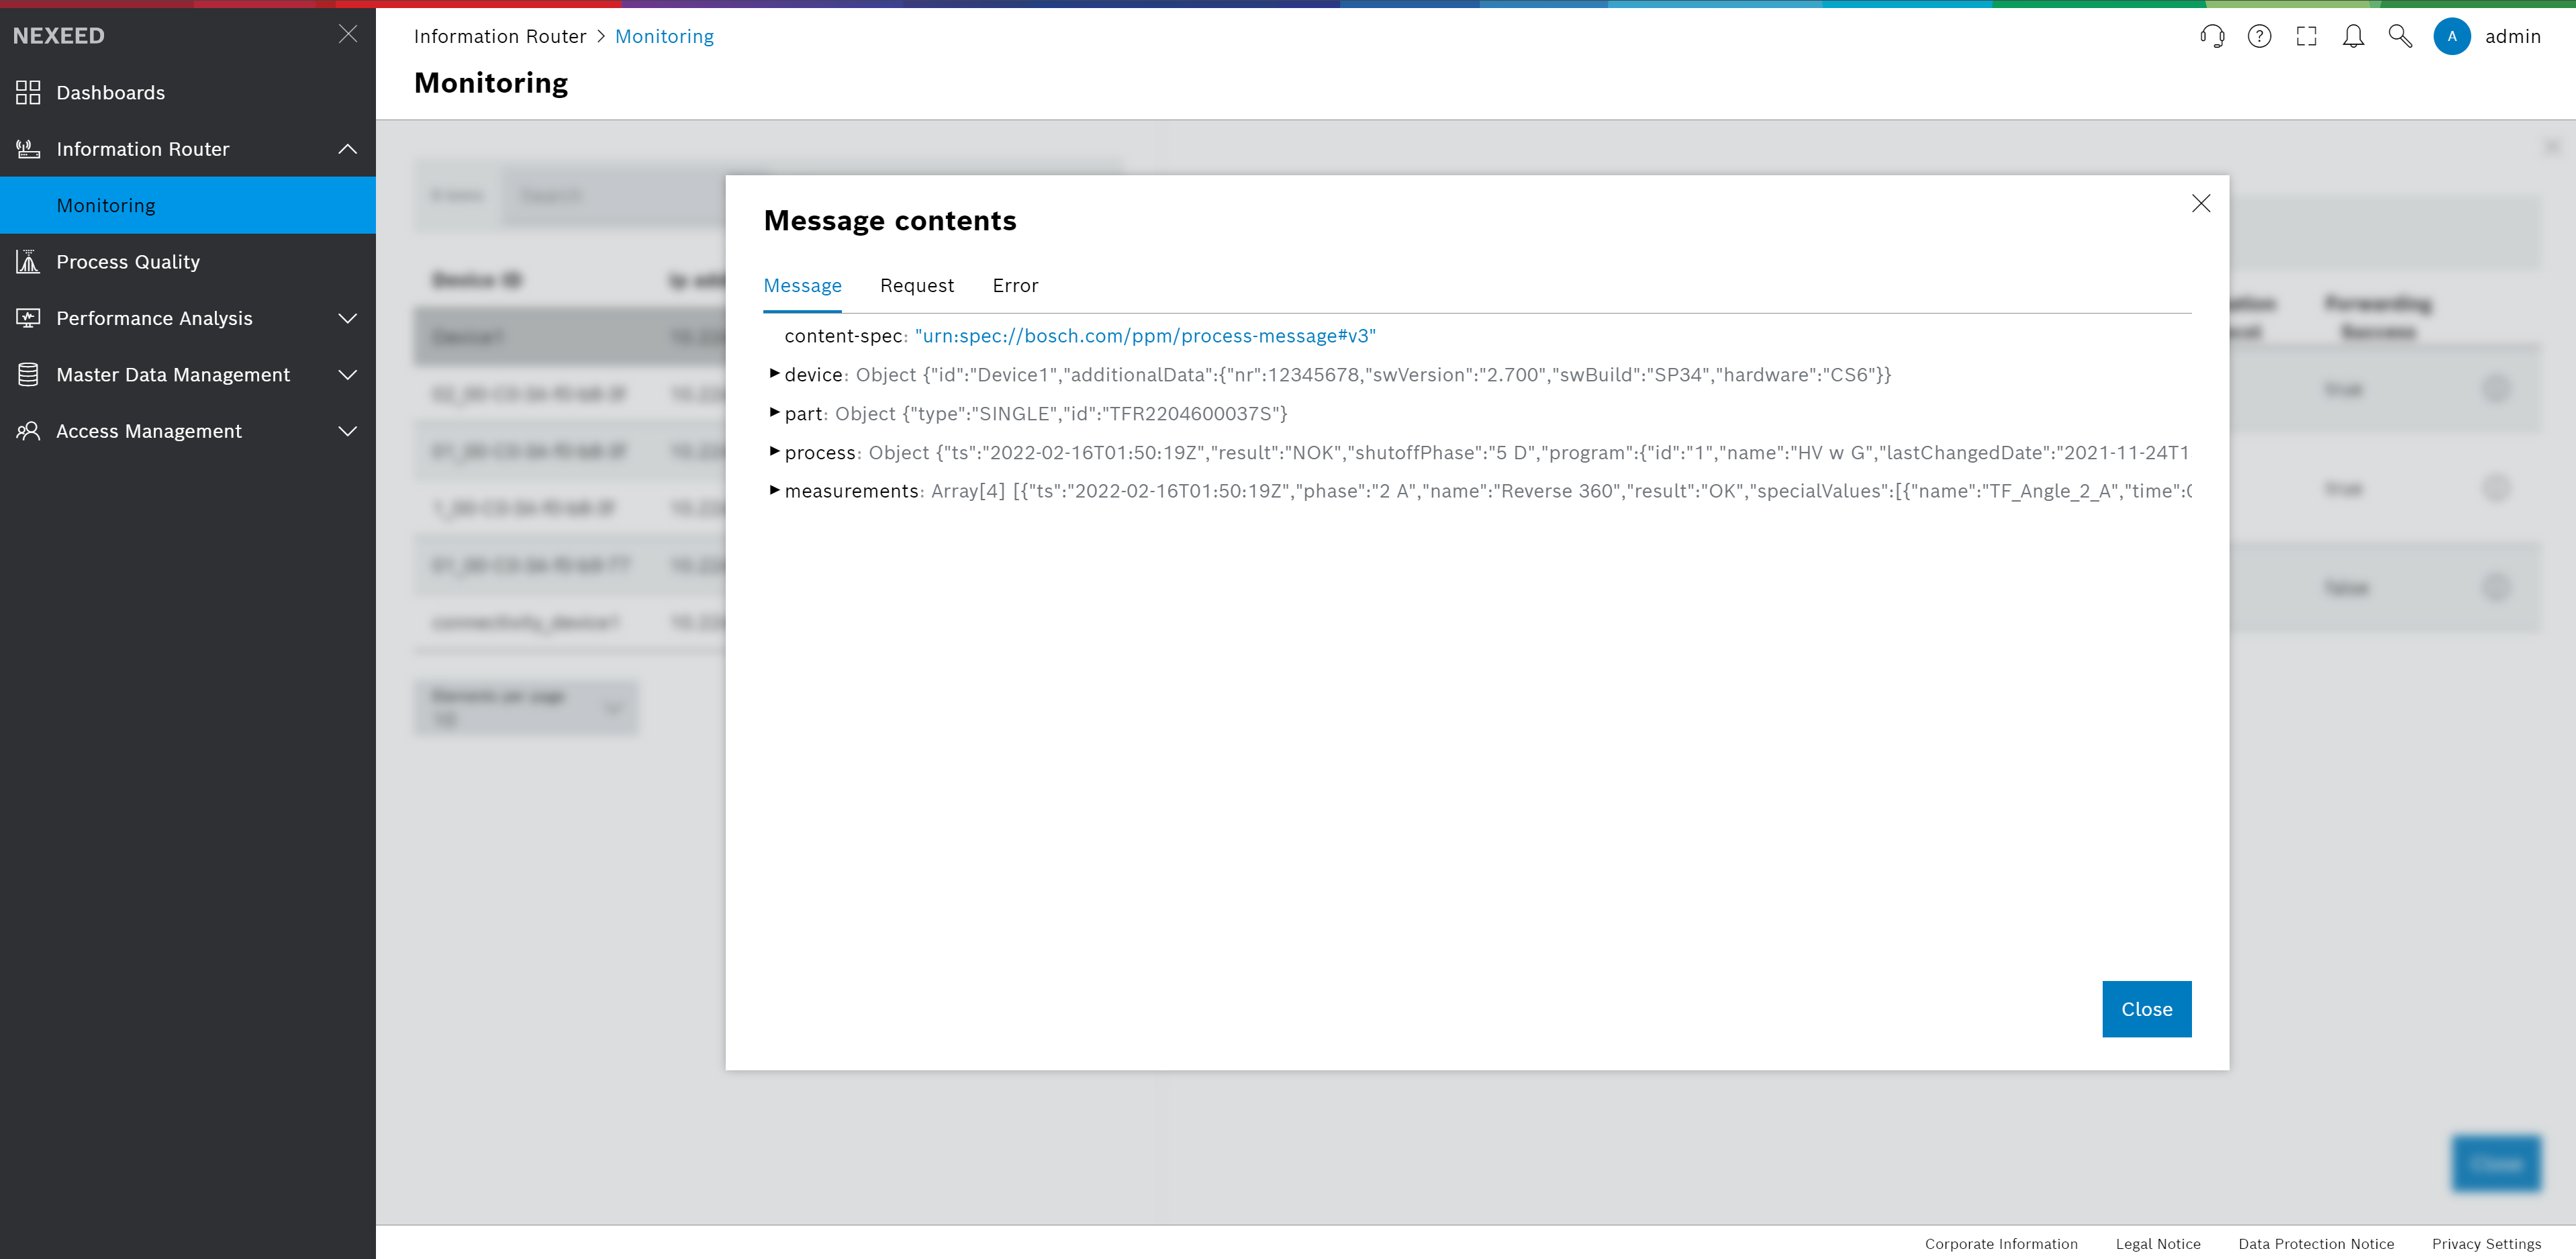
The payloads can be further expanded by clicking on the rows which contain triangular black errors at the beginning or the row itself.
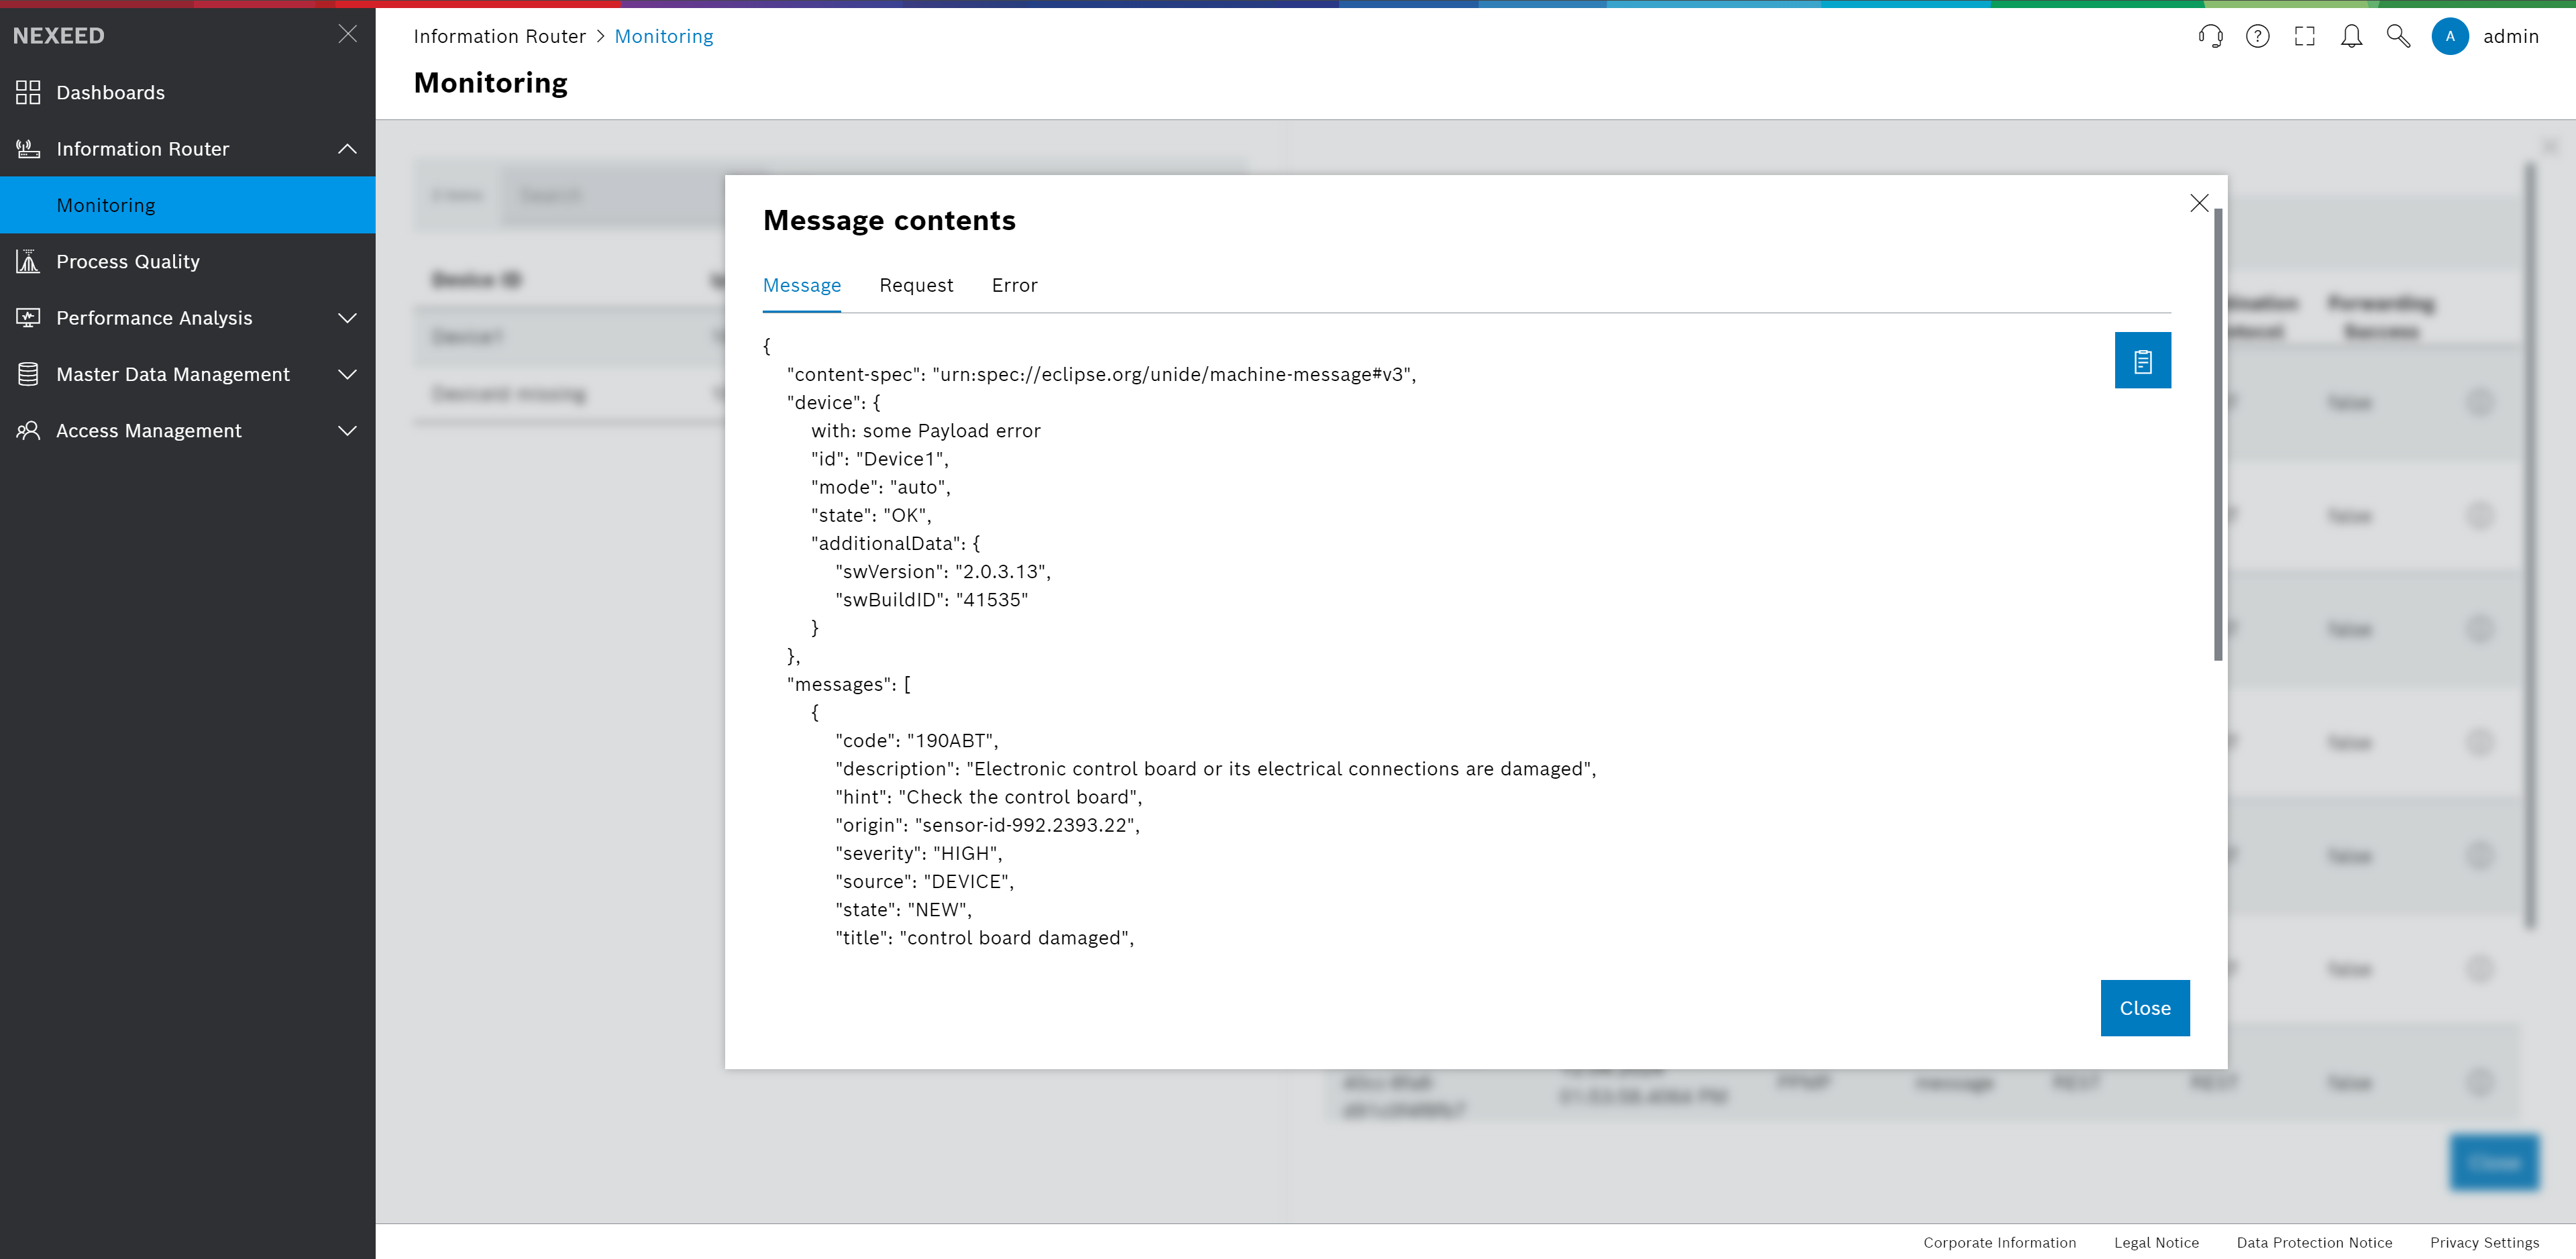
If the payload sent to information router contains invalid JSON, the information router can not determine its device id and it will be shown in the device list as "DeviceId missing". The payload of these messages will be displayed as plain text in the Message tab. For inspection of the payload in a text editor it can be copied by clicking on the clipboard button in the top right corner of the message.