SOT
    • Introduction
    • User manual
      • Line Overview
      • Part Count View
        • Configuration Part Count View
      • Part Count Chart
      • Incident map
      • Information Screens
        • Visitor Info
        • Visitor Info Compressed
        • Break View
      • Process Escalation
      • Terminal selection
      • Configuration Overview
        • General Configuration
        • Terminals Configuration
          • Adding a Terminal
          • Editing a terminal
        • Incident Map Configuration
        • Process Escalation Configuration
          • Configure a line for the first time
          • Edit line configuration
          • Add, edit, copy, delete error patterns
        • Audio Settings
          • Upload Audio Files
      • Additional information
        • Automatically switch views in the browser
          • Configure Revolver-Tabs
        • Custom KPIs
        • Font size control via URL
    • Operations manual
    • API documentation
      • HTTP API
      • Event API
    • Glossary
Andon Live
  • Smart Operations Toolkit
    • Deviation Processor
    • Multitenant Access Control
    • Notification Service
    • Ticket Management
    • Web Portal
  • Shopfloor Management
    • Andon Live
    • KPI Reporting
    • Operational Routines
    • Shift Book
    • Shopfloor Management Administration
  • Product & Quality
    • Process Quality
    • AI Services
  • Machine & Equipment
    • Condition Monitoring
    • Device Portal
  • Enterprise & Shopfloor Integration
    • Information Router
    • Master Data Management

SOT Learning Portal

  • Andon Live
  • User manual
  • Part Count View

Part Count View

The Part Count View shows the currently manufactured part count in comparison to the target part count and any pending errors/warnings as well as their duration.
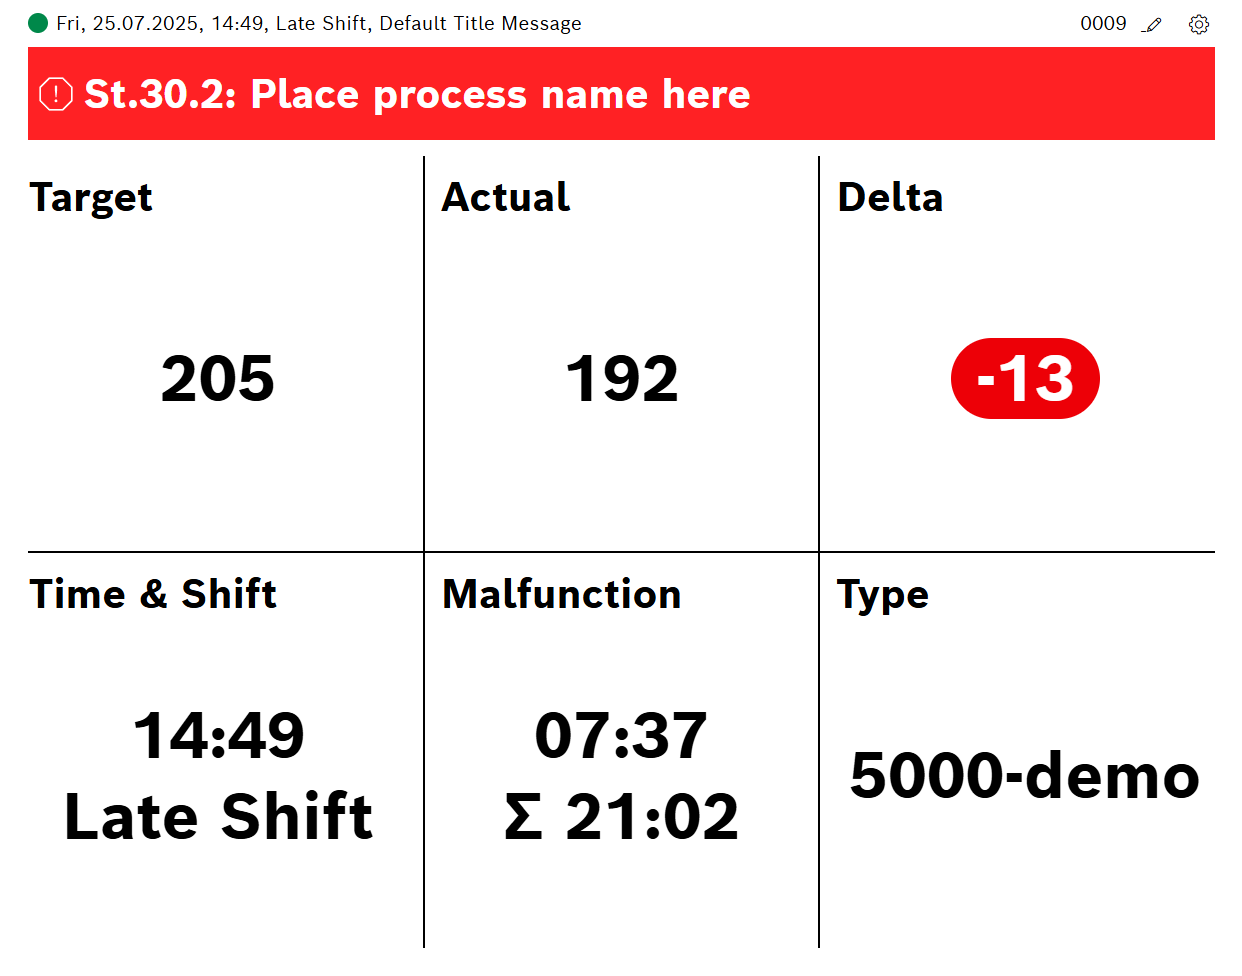
Part Count View

Header

Element Description

Fri. 17.02.2023 - 10:21

Date and time of the currently shown data

Late Shift

Name of the current shift

Default Title Message

Title message: Edit terminal

0009

Current production line ID. Will show either the name or the ID, see Edit terminal

edit_icon

Select a production line based on the selected terminal. (Only visible if more than one production line is configured for the terminal.)

settings_icon

Open the Configuration menu to configure the Part Count View settings. See Configuration Part Count View.

andonlive_part_count_station

Number and status of the station with a warning/fault. A maximum of six stations is shown. The status is marked by the background color:

  • Blue: PLC message: Edit terminal

  • Yellow: Warning

  • Red: Malfunction

The layout is either a rectangle or a full row depending on the checkbox "station name" in Edit terminal.

Not displayed if there is no warning/fault.

Data squares

Six data squares are provided to show KPI values. The font size as well as the content of the squares can be configured in Configuration Part Count View.

Only three data squares are shown if more than three status information are shown for a line.

Contents

© Robert Bosch Manufacturing Solutions GmbH 2023-2026, all rights reserved

Changelog Corporate information Legal notice Data protection notice Third party licenses