The concept and conventions
SOT is a distributed system consisting of multiple self-contained modules which function together. The concept implemented focuses on the aspect of centralized operations of many systems. One key to having control and good observability of such a system is to treat specific logs as a kind of API, which has to be implemented by any operated system. This insight leads us to the need to log at least everything which enables support, operations, and monitoring in a homogenous and standardized way over all SOT components.
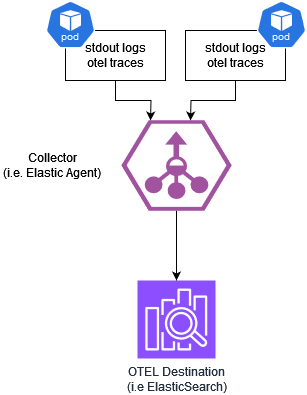
All components of the system send metrics, traces, and logs to a log aggregator (for example, the ELK stack) allowing us to:
-
provide information as one source for monitoring the behavior and health from an inner application perspective
-
record failures
-
debug the application if necessary, e.g., while reproducing reported failures
-
track usage statistics of APIs
-
record security-relevant events
General logging conventions
The following are the guidelines implemented by each application module regarding logging:
-
No request-based logging per default
Request-based logging is avoided. It can only be enabled temporarily and only limited to specific components. Anything else is logged in an aggregated way. -
Technology-independent log pattern
All applications log in the same manner, independent of used programming languages or frameworks. -
Configurable log level
The log level is treated as a configuration. The log level can be configured externally. -
Environment independent logging
The log is runtime environment independent, so whether the application runs on azure, on-premise, or elsewhere doesn’t matter. -
Log analysis tool independent logging
Supporting a new log aggregator do not trigger a release cascade of all applications. In other words, the log analysis tool is independent of logging. -
Single line messages
Logs are written as single-line formatted JSON - no line breaks. -
Log to stdout
Logs are written tostdoutfor collection. -
Log in English
Log messages presented to the end user are written in English.
Log levels
Log levels are configurable and can be one of the following. The default log level for SOT modules is WARN if it not defined differently.
-
TRACE- Anything at statement level such as start to calculate something, query something, loop x of y, etc… is logged atTRACElevel. -
DEBUG- Anything at the method or request processing level, e.g[].,-
method entered or return with …. is logged at
DEBUGlevel -
HTTP GET /some resource took 5 seconds status 200but also 4xy statuses
-
-
INFO- In the following cases, the information is logged atINFOlevel, e.g.,-
Process life cycle messages, such as
-
application started
-
application ready
-
shutdown application
-
-
Administrative events, such as
-
(re)load or flush caches
-
(re)load configuration
-
database migrations
-
-
handled exceptions, which do not require any additional investigations, such as
-
connection refused, try reconnect in X seconds
-
-
-
WARN- Uncommon behavior or situations, e.g.,-
unavailability of services
-
security related events (potentially malicious)
-
handled failures that prevent the application from working, usually as long as the application can recover automatically
-
-
ERROR- Anything which potentially leads to unexpected behavior or crashes, e.g.,-
unhandled failures
-
implementation failures
-
Configuration of default log levels during deployment
It is possible to configure the log level for all SOT modules during the helm deployment in a standardized way. The default log level is WARN.
All modules have two logging parameters:
-
default- This parameter is used for all logging configurations as a fallback -
application- This parameter is used for the logs that are written by the SOT applications. The logs normally include only logs from the business logic and exclude logs from frameworks
Some modules have further logging parameters defined (e.g. for different frameworks) which are documented in the module’s operations manuals. The log levels can be configured during the helm deployment via helm override file. It is possible to set the log level parameters per module or globally which will effect all SOT modules. Example:
global:
  logging:
    default: "ERROR"
    application: "INFO"
macma:
  local:
    logging:
      default: "INFO"
      application: "TRACE"
Information of interest
This section describes the information which will be logged. General information will be logged with any log event. Depending on the case the general information will be enriched by additional information e.g. in case of request based logs a correlationId will be logged additionally together with other information described in detail in the following sections.
This section describes the information that the system logs.
General information is logged with any log event.
Depending on the case, additional information enriches the general information.
For example, in the case of request-based logs, a correlationId is logged.
The following sections describe other information in detail.
General information
| Attribute | Description | Information Origin | Required |
|---|---|---|---|
|
The version of the application, as specified during the build. |
Build time configuration. |
Yes. |
|
The time when the log was emitted as ISO 8601 formatted timestamp. |
System time. |
Yes. |
|
The thread name at which the log was generated. |
Process. |
No. |
|
The name of the system, e.g. |
Environment variable |
Yes. |
|
Stack traces of caught exceptions. |
Source code. |
No. |
|
The name of the product, the specific application belongs to. |
Build time / runtime configuration. |
Yes. |
|
One of |
Source code. |
Yes. |
|
The name of the logger. |
Source code. |
Yes. |
|
The name or identifier of the instance. |
Environment variable |
Yes. |
|
The name of the environment, e.g. |
Environment variable |
Yes. |
|
The name of the application, as specified during the build. |
Build time configuration. |
Yes. |
Request / event-based information
| Attribute | Description | Information Origin | Required |
|---|---|---|---|
|
The request related correlationId. |
E.g. request header. |
Yes, if available. |
|
|
E.g. request header. |
Yes, if available. |
|
|
E.g. request header. |
Yes, if available. |
|
The tenant in whose context the request was processed. |
E.g. access token. |
Yes, as soon as the information is available. |
|
The user in whose context the request was processed. |
E.g. access token. |
Yes, as soon as the information is available. |
The goal is to support tracing as specified by the W3CTraceContext, OpenTelemetry/Tracing, and OpenTelemetry/Logging specifications.
Since not all components are migrated simultaneously, the correlationId header is still supported.
As soon as all components support the standard tracing approach, the support for the correlationId will be removed.
LIFE-CYCLE log
The following information is logged to know when an application started, stopped, and is ready.
| Attribute | Description | Required | Default |
|---|---|---|---|
|
|
Yes. |
N/A |
|
|
Yes. |
N/A |
|
One of:
|
Yes. |
N/A |
|
An optional reason phrase. |
No. |
N/A |
SECURITY logs
Security-related events which are logged are, for example:
-
call to non existing endpoints
-
rejected calls, e.g., caused by failed input validation
-
unauthorized calls
-
signature verification failures
-
usage of expired tokens
| Attribute | Description | Required | Default |
|---|---|---|---|
|
|
Yes. |
N/A |
|
One of:
|
Yes. |
N/A |
|
Yes, as soon as the information is available. |
N/A |
|
|
Yes, as soon as the information is available. |
N/A |
|
|
Yes, as soon as the information is available. |
N/A |
|
|
Yes, as soon as the information is available. |
N/A |
|
|
Yes, as soon as the information is available. |
N/A |
|
|
Yes, as soon as the information is available. |
N/A |
|
|
What happened, e.g
|
Yes. |
N/A |
|
An optional reason phrase. |
No. |
N/A |
OpenTelemetry integration
The following section describes the configuration and usage of SOT in combination with OpenTelemetry (OTEL).
Configuration of default OpenTelemetry during deployment
It is possible to configure the OpenTelemetry agents for all SOT modules that are supporting OpenTelemetry during the Helm deployment in a standardized way.
The proper environment variables for OTEL agent are injected automatically in all pods via a configmap (otel-observability-configmap), a secret (otel-observability-secret) and a pod environment variable (OTEL_SERVICE_NAME).
One can disable the automatic injection by setting the following variable in the module local section:
<module>:
  local:
    observability:
      otelAutoInjectEnvParams: false
In the observability node of the global section you can define defaults for all modules supporting OpenTelemetry. You can enable or disable the exporter or the feature flags for tracing, metrics, or logging. The default for all settings is disabled. You can overwrite the global configuration by module-specific configuration in the local section of the module.
global:
  observability:
    otlpEnabled: true
    otlpTracingEnabled: true
    otlpUrl: "<yourUrl>"
    otlpHeaders: "<headerContainingYourAuthenticationSecrets>"
macma:
  local:
    observability:
      otlpTracingEnabled: false
The following settings can be configured in both global umbrella chart and module local dictionary under observability key, local dictionary having precendence over global one:
| Parameter | Required | Description |
|---|---|---|
observability.otlpUrl |
yes |
The URL endpoint for the OpenTelemetry Protocol (OTLP) collector. |
observability.otlpEnabled |
no |
Flag to enable or disable the OpenTelemetry Protocol (OTLP) exporter. |
observability.otlpTracingEnabled |
no |
Flag to enable or disable tracing for OpenTelemetry Protocol (OTLP). |
observability.otlpMetricEnabled |
no |
Flag to enable or disable metrics for OpenTelemetry Protocol (OTLP). |
observability.otlpLoggingEnabled |
no |
Flag to enable or disable logging for OpenTelemetry Protocol (OTLP). |
observability.otlpHeader |
yes if otel collector/endpoint requires authentication |
The header of the messages for OpenTelemetry Protocol (OTLP). Will be mapped to a secret as it might contain the Authorization Secrets. |
observability.otelResourceAttributes |
no |
A comma-separated list of key-value pairs to define resource attributes, which describe the entity producing telemetry data. Example: 'deployment.environment=<myEnvironmentKey>' |
observability.otlpProtocol |
no |
Protocol used for otel communication - one of grpc, http/protobuf or http/json |
observability.tracesSampler |
no |
Sampler to be used for traces |
observability.tracesSamplerArg |
no |
String value to be used as the sampler argument |
For more information about the values which can be passed in the variables please consult OTEL agent official documentation.