Dashboards
The Dashboard serves as a flexible and central entry point into the Nexeed Industrial Application System. It allows you to bundle and clearly display relevant information from various licensed modules in the form of widgets.
A dashboard is a workspace that you can design according to your individual requirements. Simply add the desired widgets — such as KPI charts, machine events, or maintenance status — onto your dashboard interface. The arrangement and size of the widgets are freely configurable.
You can create personal dashboards for your daily tasks as well as provide and share predefined dashboards for entire teams or departments. This ensures that all stakeholders always have access to the same relevant information and can make decisions based on solid data.
Roles and permissions
Access to dashboard features depends on roles assigned in Multitenant Access Control (MACMA) and permissions assigned by space owners. The following MACMA roles are relevant for dashboards:
-
Web Portal User: default role for all users providing access to Web Portal and the IAS. It grants access to view and use dashboards that are shared with the user and to create private dashboards in My Space. It does not allow creating or sharing spaces. -
Web Portal Admin: adjusts system settings such as disabling the dashboards menu entry. -
Web Portal Dashboard Space Admin: creates and manages spaces, space owners and sharing. Space admins can view all spaces to manage them and their associated permissions. However, they are not necessarily space owners and may therefore not be able to access the space.
Next to the Web Portal roles in MACMA, space owners can assign view or edit permissions to users or groups for each space. View permission allows access to dashboards without edit rights, whereas edit permission enables dashboard editing but not space configuration.
-
Space Owner: manages the space, its dashboards, and permissions. When a space is created by a Dashboard Space Admin, the creator is automatically assigned as space owner. Space admins and space owners can add further space owners and editors, or remove them from the space. -
Dashboard Editor: edits dashboards (adds, removes, and configures widgets) but not the space configuration. -
Dashboard Viewer: opens but does not edit the dashboards.
Spaces overview
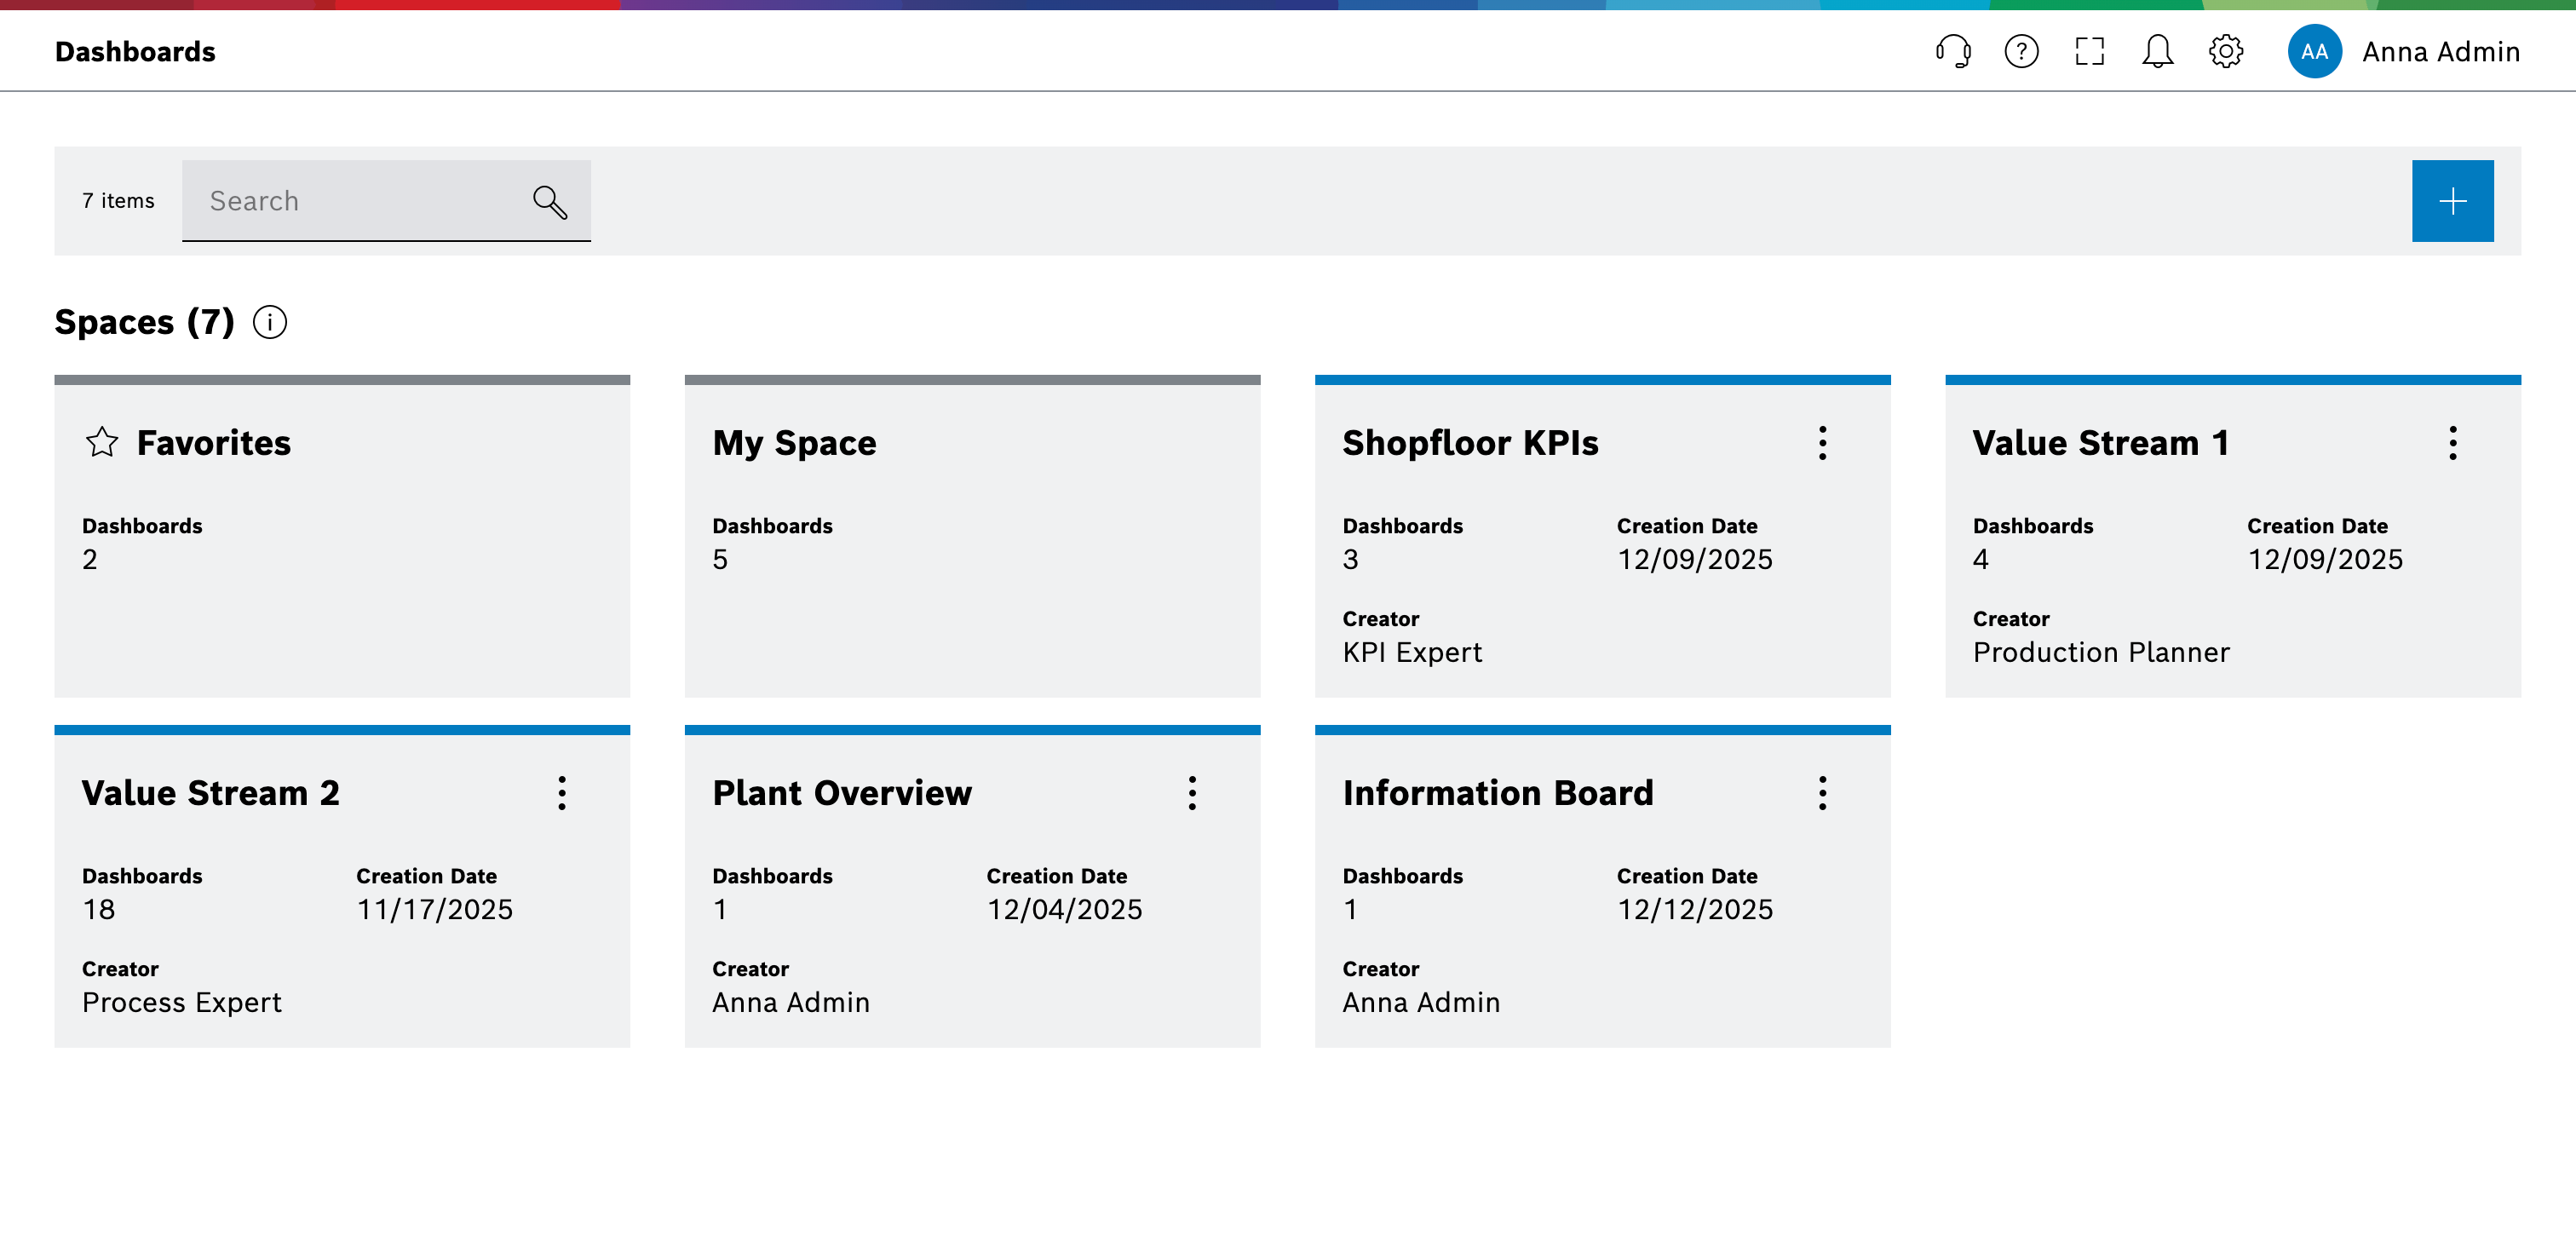
Dashboard spaces group dashboards for a specific audience or purpose.
-
The Favorites and My Space spaces are always shown. Additional spaces appear when the Dashboard Space Admin role creates them or when someone shares a space with the user.
-
When a user opens Dashboards for the first time, the spaces overview is displayed. The next visit opens the last opened page that was viewed, i.e. either the last viewed dashboard or space, or the space overview.
Space details
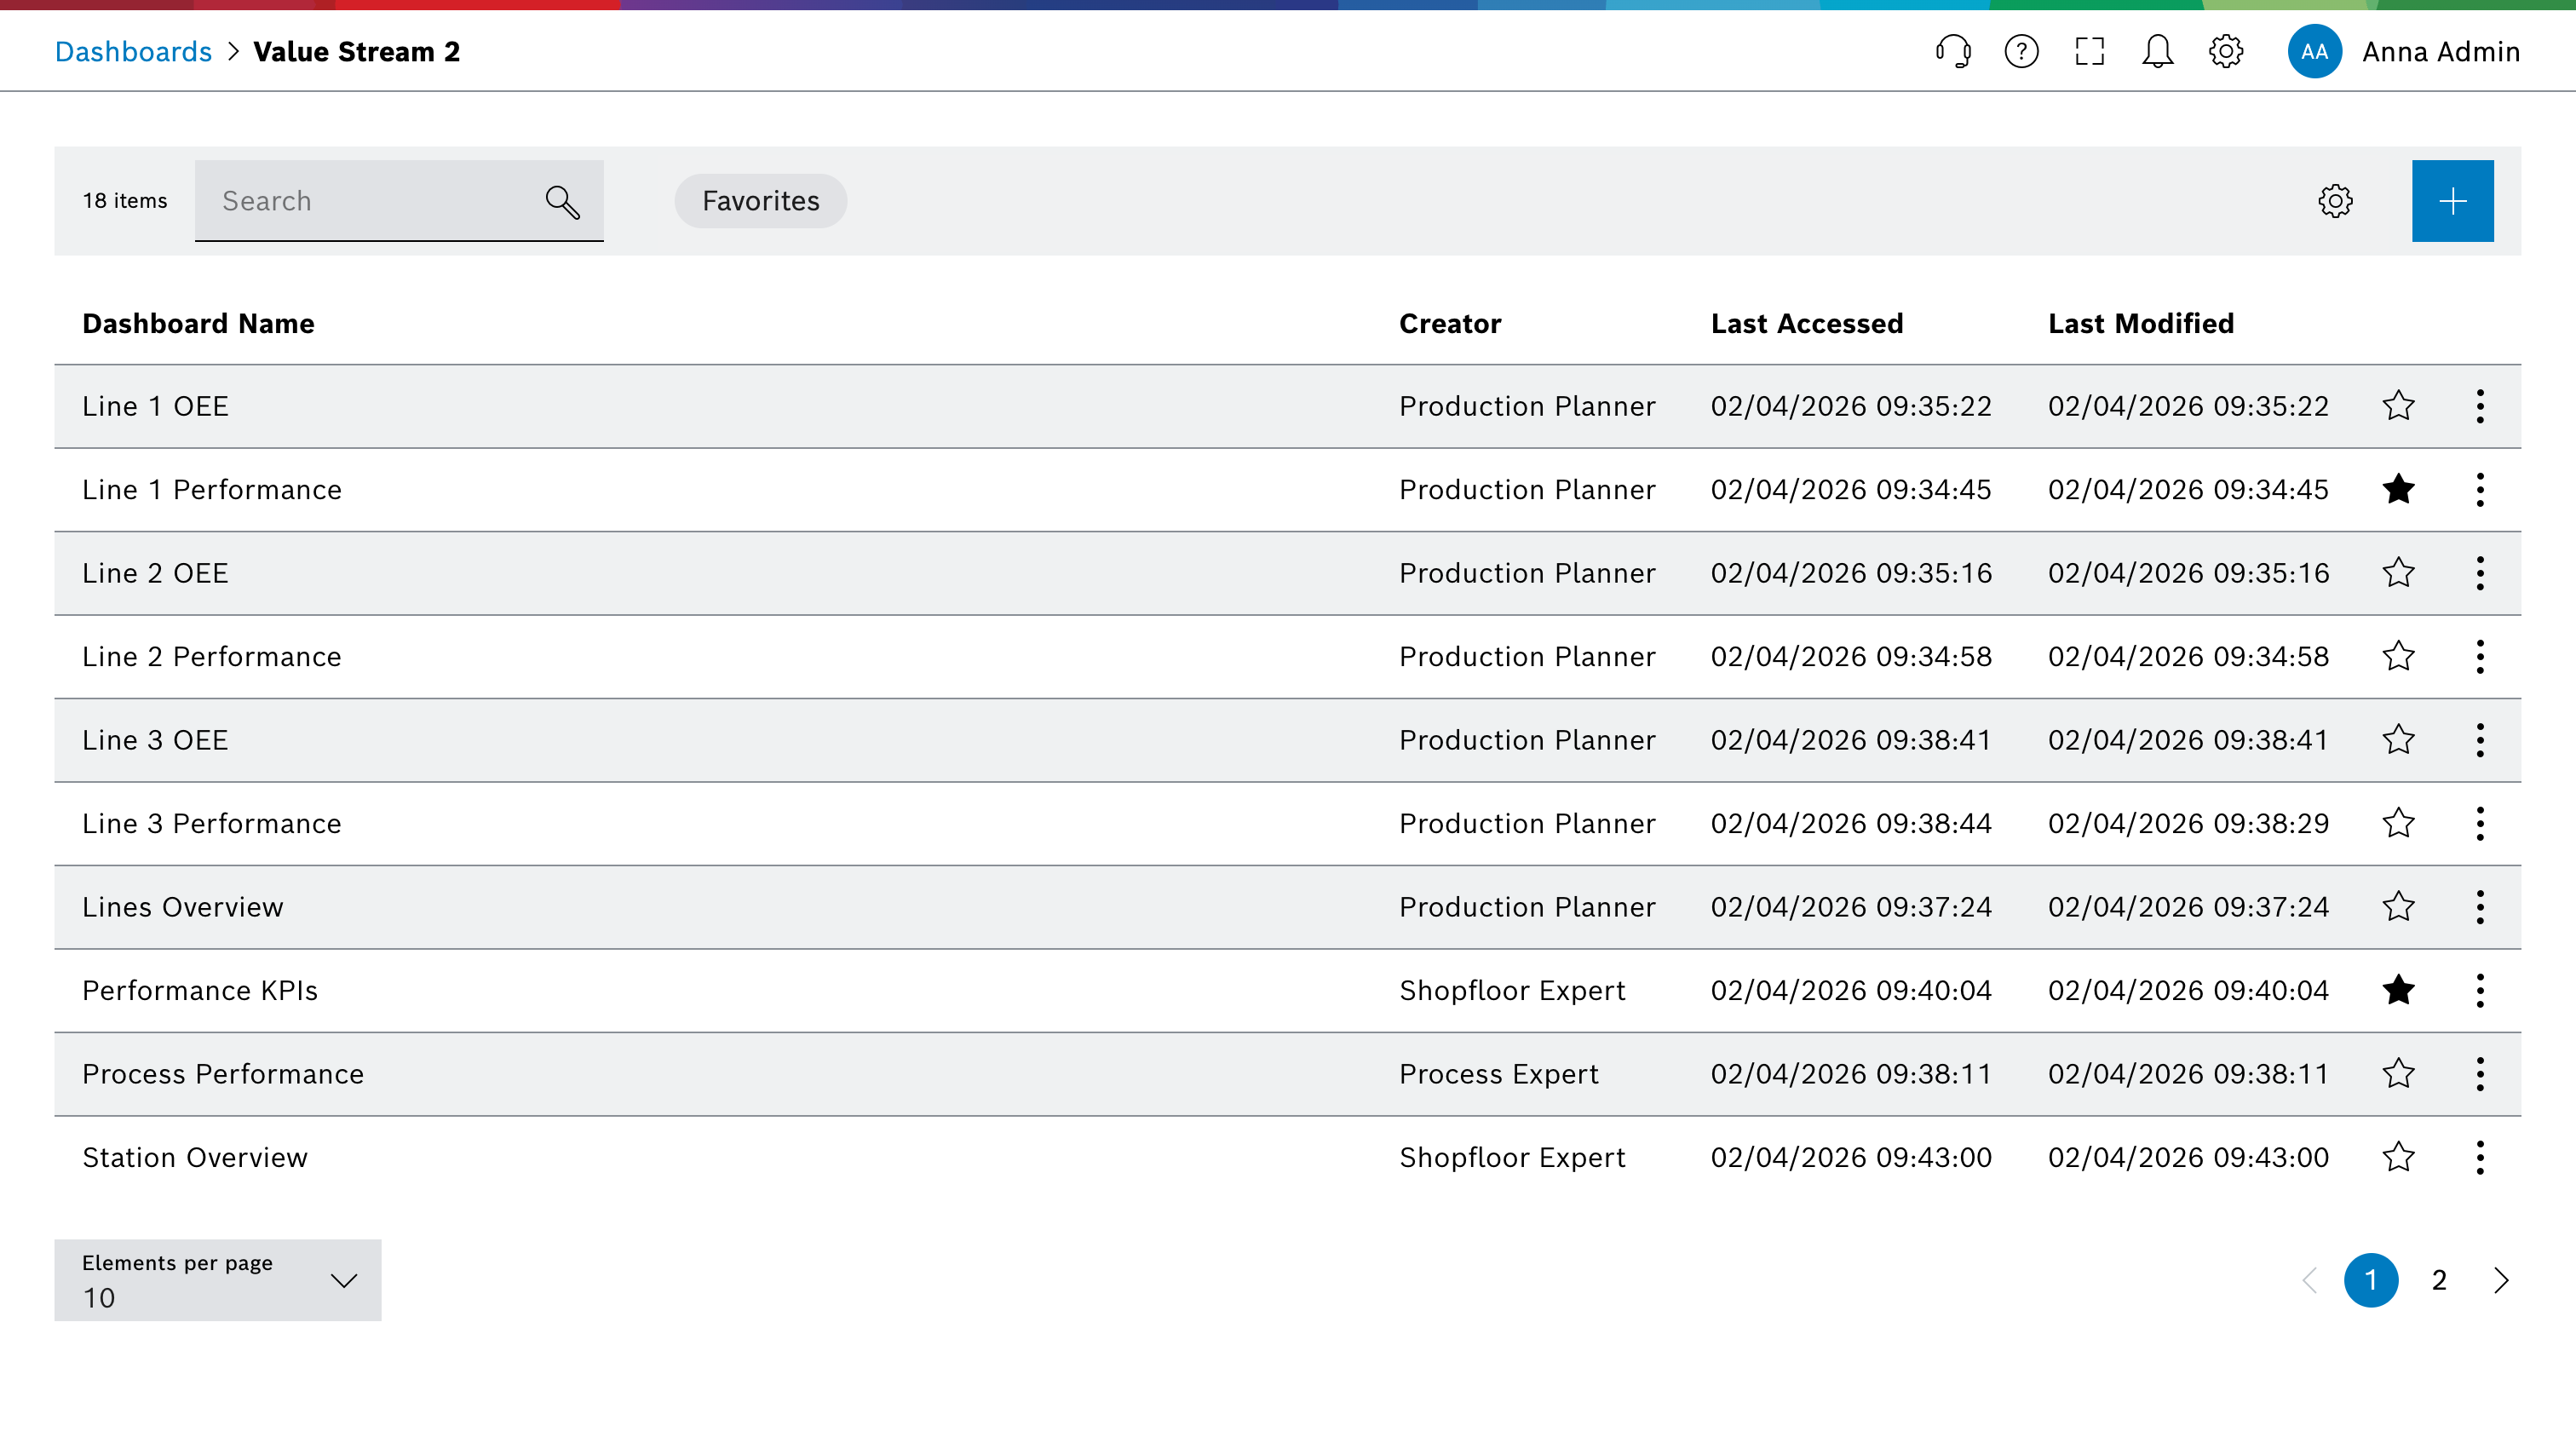
Selecting a space opens a table with all dashboards inside that space.
-
Column headers provide ascending and descending sorting. Pagination keeps the list responsive in large spaces.
-
Quick filters highlight favorites. A search field narrows the list to matching dashboard names.
-
Columns can be shown or hidden per user session. Available columns include creator, last modified date and last accessed date.
-
The action icons in each row respect permissions:
-
Favorite toggle adds or removes the dashboard from the Favorites.
-
Configure opens edit mode to rename the dashboard for users with edit permission.
-
Copy or Move requires at least view rights on the current space and add rights in the target space.
-
Delete is only visible for space owners.
-
-
Space owners can create dashboards via the Add button in the command bar.
Dashboard view
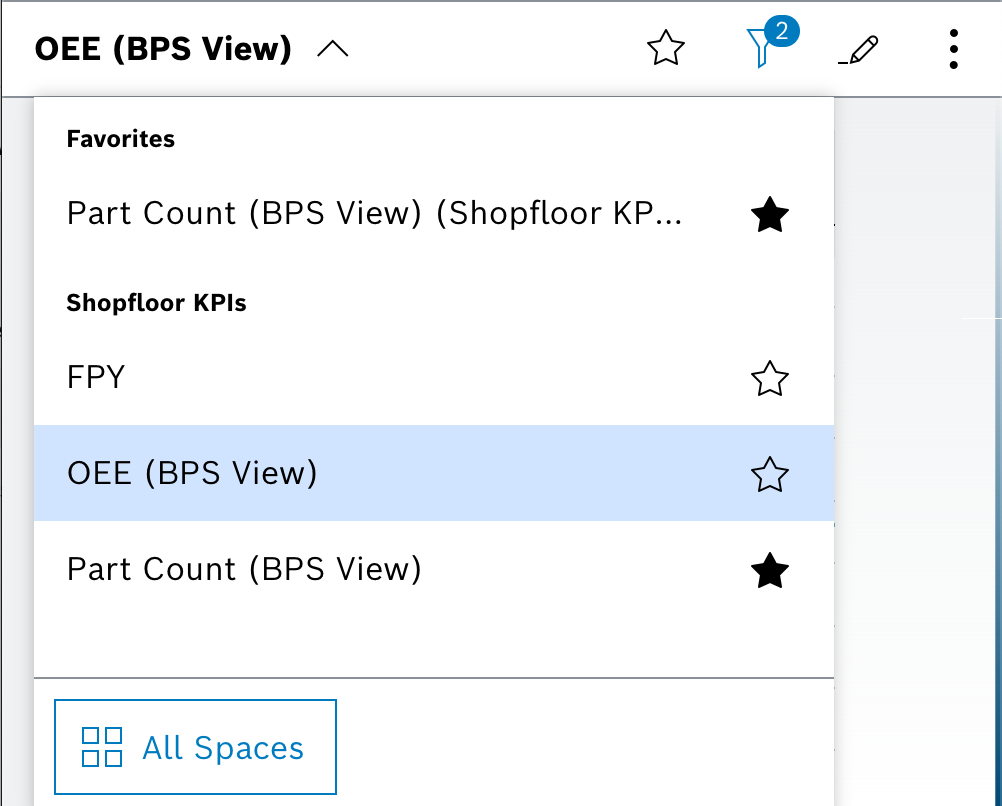
When a dashboard is opened, the content is displayed below a toolbar that keeps navigation and filters in reach.
Toolbar elements
-
Dashboard selector: easily access other dashboards in the space. Favorites stay at the top and an All spaces entry returns to the spaces overview.
-
Favorite button : toggles whether the dashboard appears in Favorites and in favorite filters.
-
Filter button : opens the filter bar with equipment (facility) and time filters. An indicator shows when filters are applied.
-
Edit mode button : switches to edit mode for users with edit rights. The button is hidden for readers.
-
More button : provides rename, copy, move or delete options depending on permissions.
Horizontal scrolling and layout
Dashboards provide a flexible grid with about 12 columns on a 1920px wide screen. When additional columns are required, the canvas expands to the right and users scroll horizontally to reach them. Zoom levels preserve a 1:1 cell ratio so that widgets remain legible on large and small displays.
Filters and templates
Dashboard filters always apply to the current dashboard only. The filter bar contains:
-
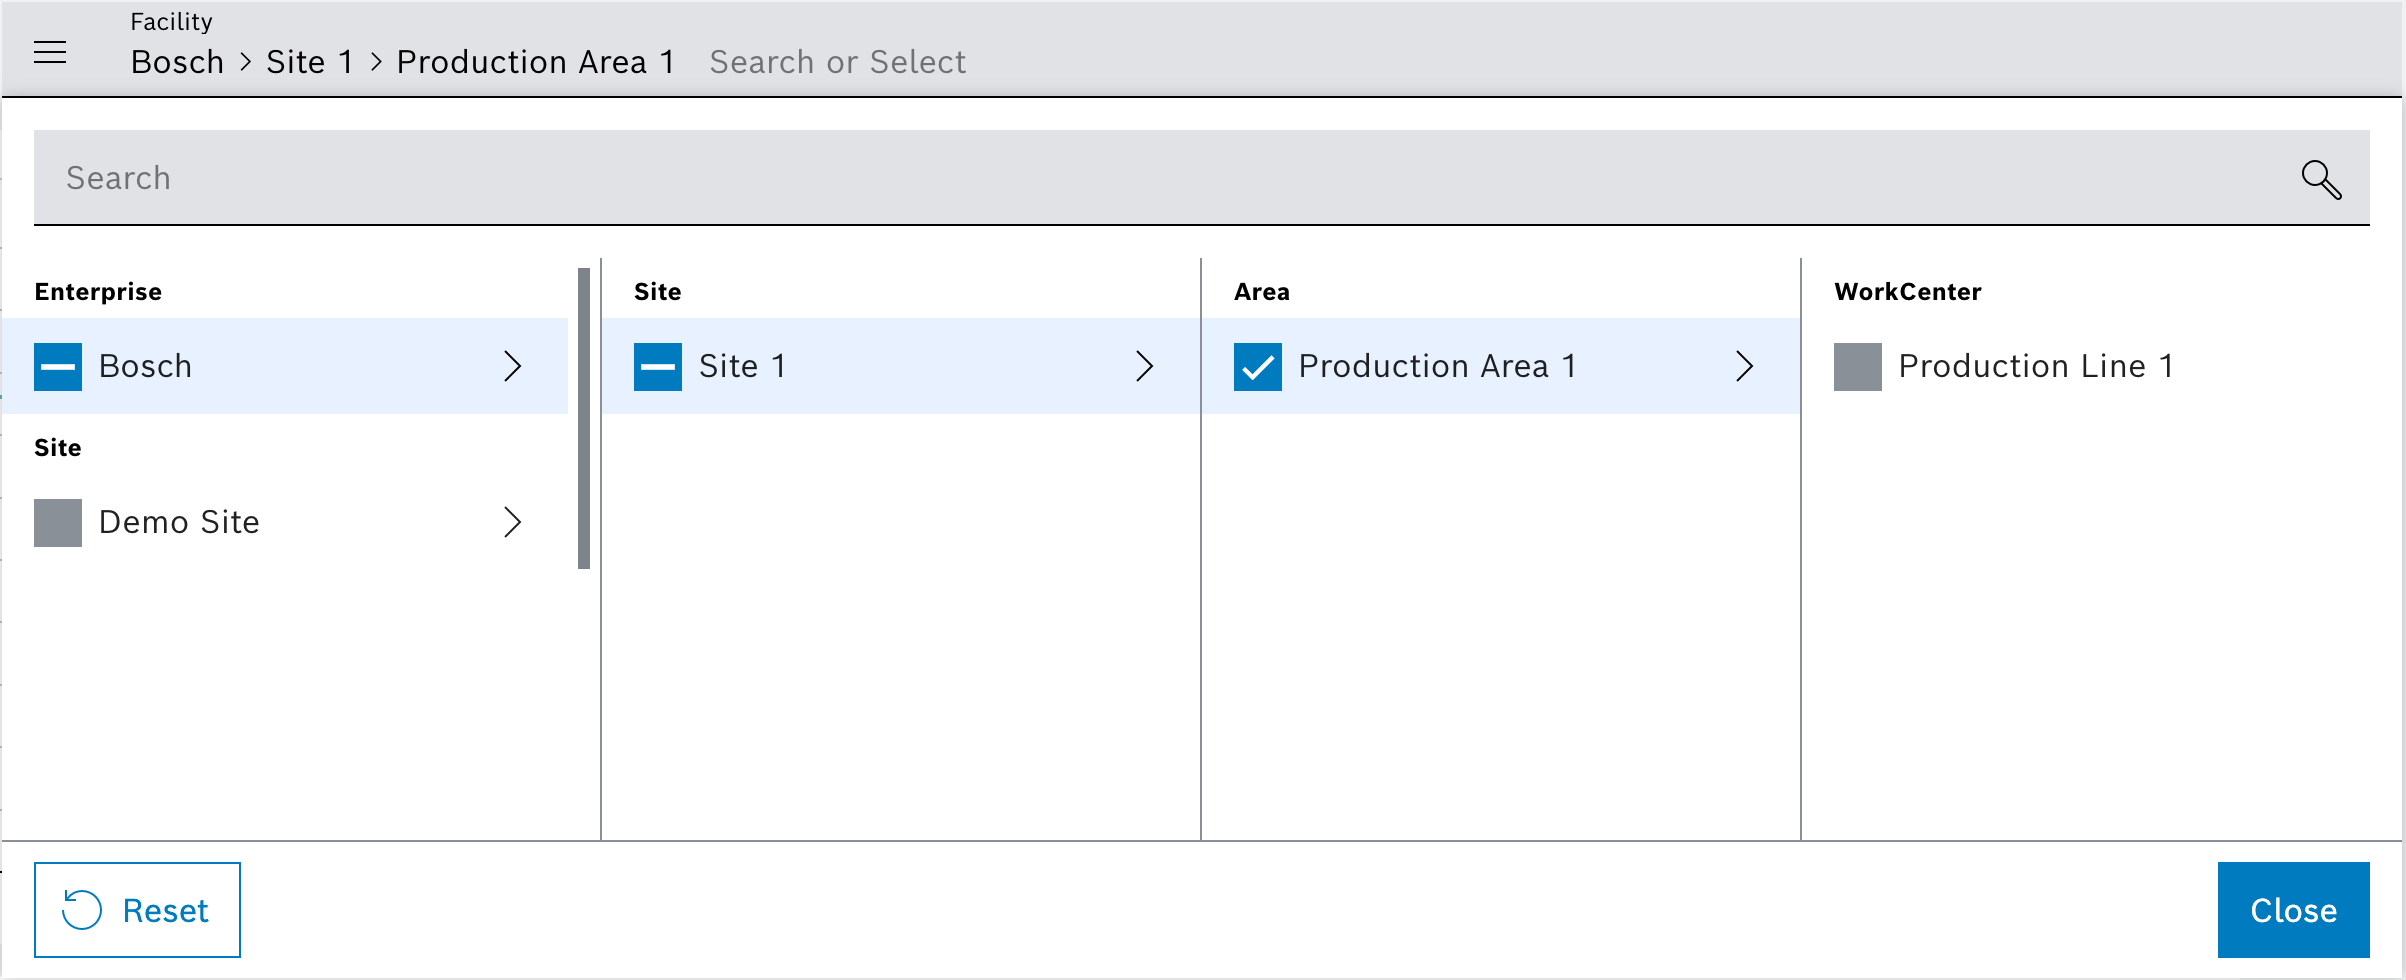
Facility selector: lists equipment from Master Data Management. A single selection is allowed and is stored together with the dashboard URL in order to preserve the filter state and share it via bookmarks.
-
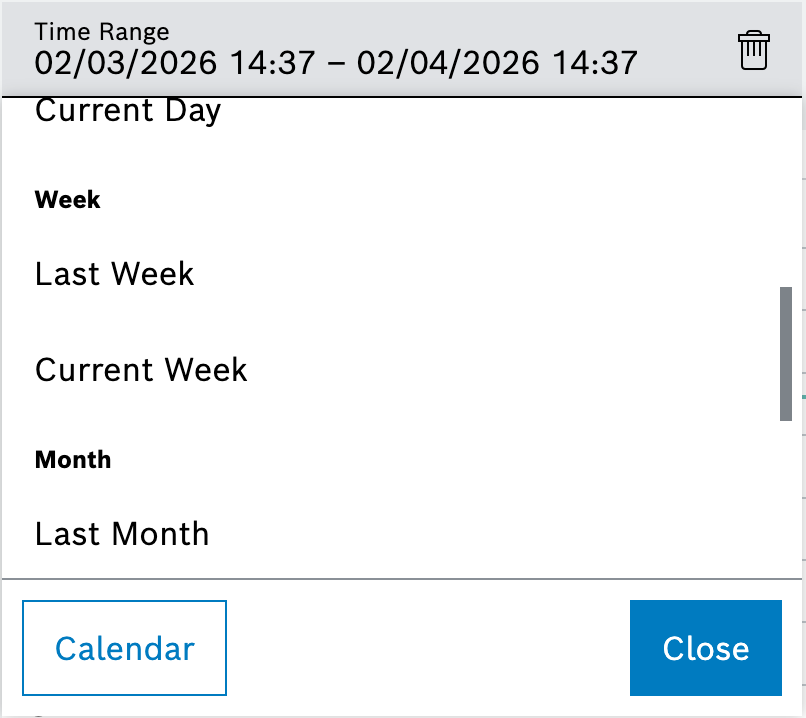
Time range: users choose absolute start and end times or select templates. Templates cover a variety of common use cases such as Last day, Last month, Current quarter or Current year. Whenever a template or time range is applied, the parameter is appended to the dashboard URL. Widgets refresh as soon as filters are applied.
Favorites
Users can favorite their own dashboards and dashboards shared with them. Favorites behave consistently in every list:
-
Favorite dashboards appear in the Favorites space and the dashboard selector.
-
The space table quick filter Favorites limits the list accordingly.
Sharing dashboard spaces
Space owners share their spaces with Multitenant Access Control (MACMA) individuals or groups from the same organization. View permission grants access to dashboards without edit rights, whereas edit permission enables dashboard editing but not space configuration. All shared spaces appear in the recipient’s space overview.
|
Documentation for configuring MACMA groups is available at Multitenant Access Control documentation. |
Only space owners can change the sharing setup or delete the space. Recipient permissions update automatically when MACMA group membership changes.
Widget catalog sidebar
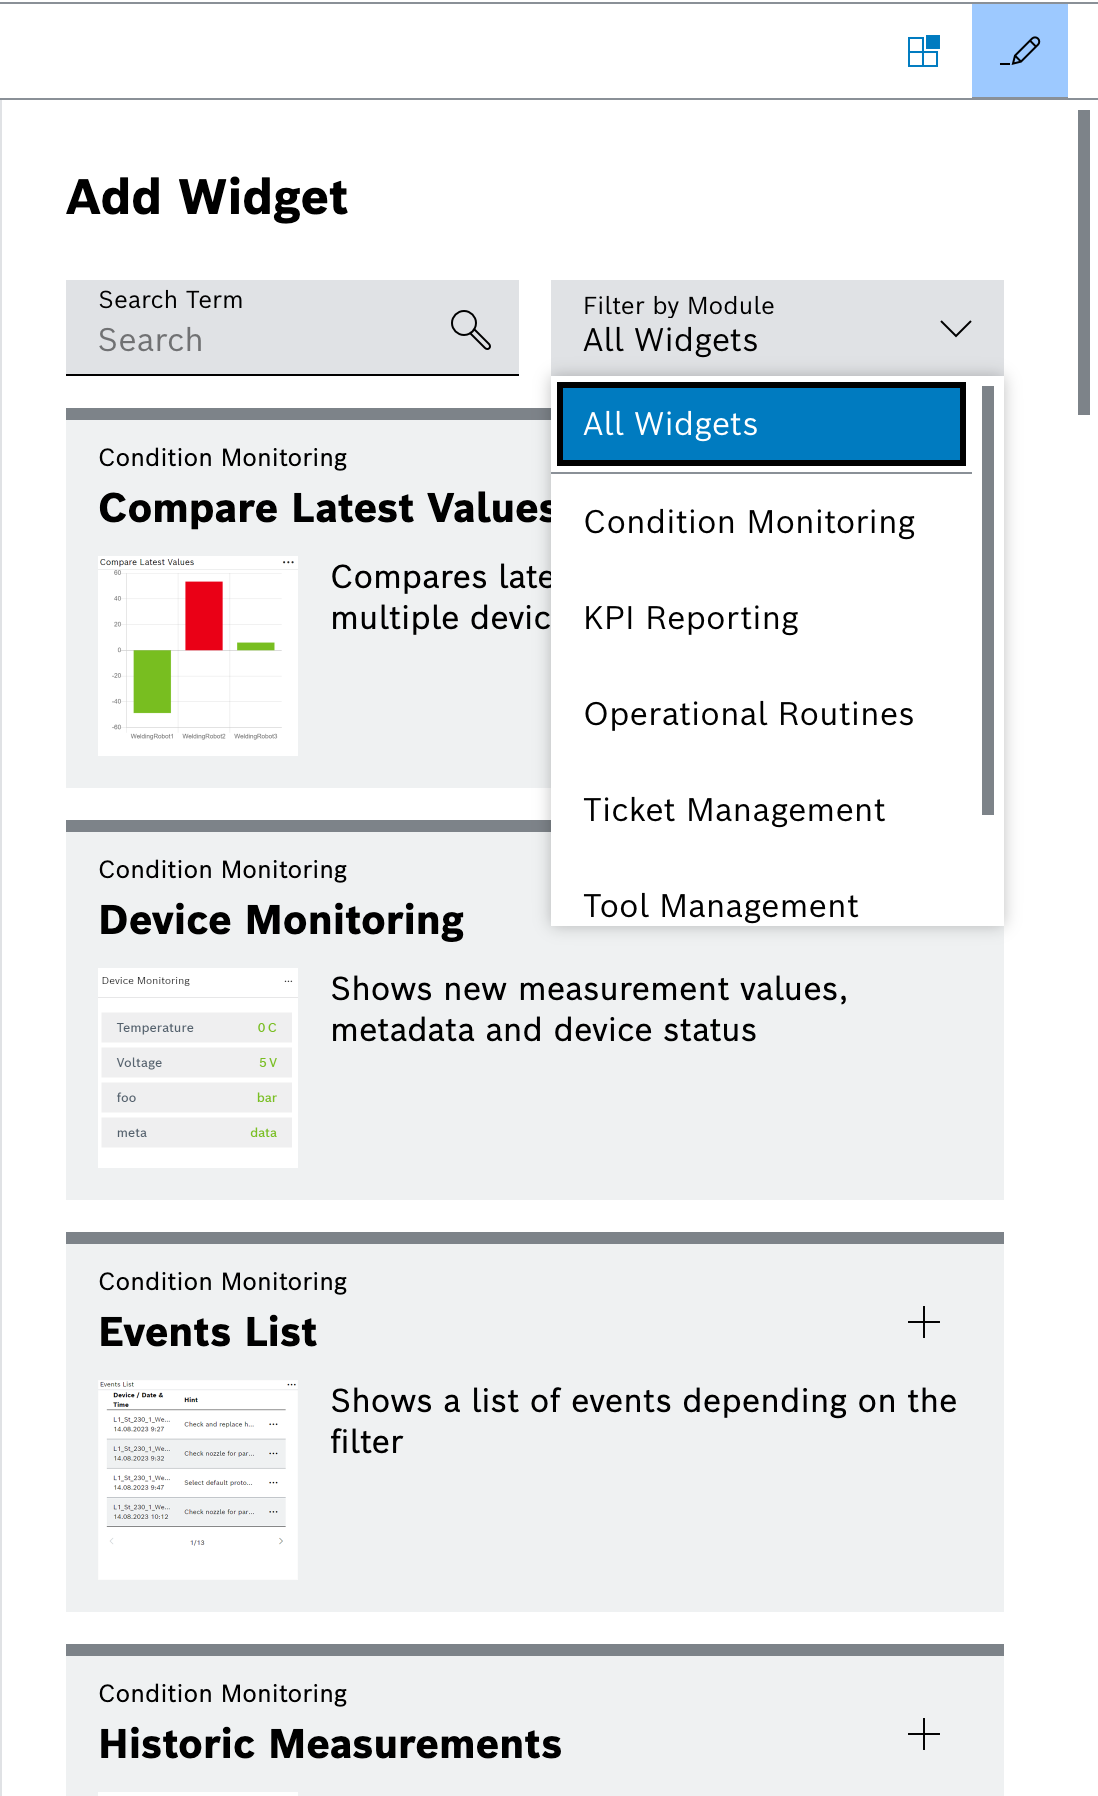
Entering edit mode opens the widget catalog as a sidebar on the right. The dashboard canvas remains visible on the left so that editors keep full context.
-
The widget catalog can be toggled via the widget catalog button in the toolbar.
-
Widgets can be added from the sidebar onto the dashboard grid. The grid resizes automatically horizontally and vertically.
-
A module filter shows only widgets provided by the selected module. Selecting All modules resets the list.
Web Portal widgets
In addition to widgets delivered by licensed modules, Web Portal provides baseline widgets that are always available in the catalog:
-
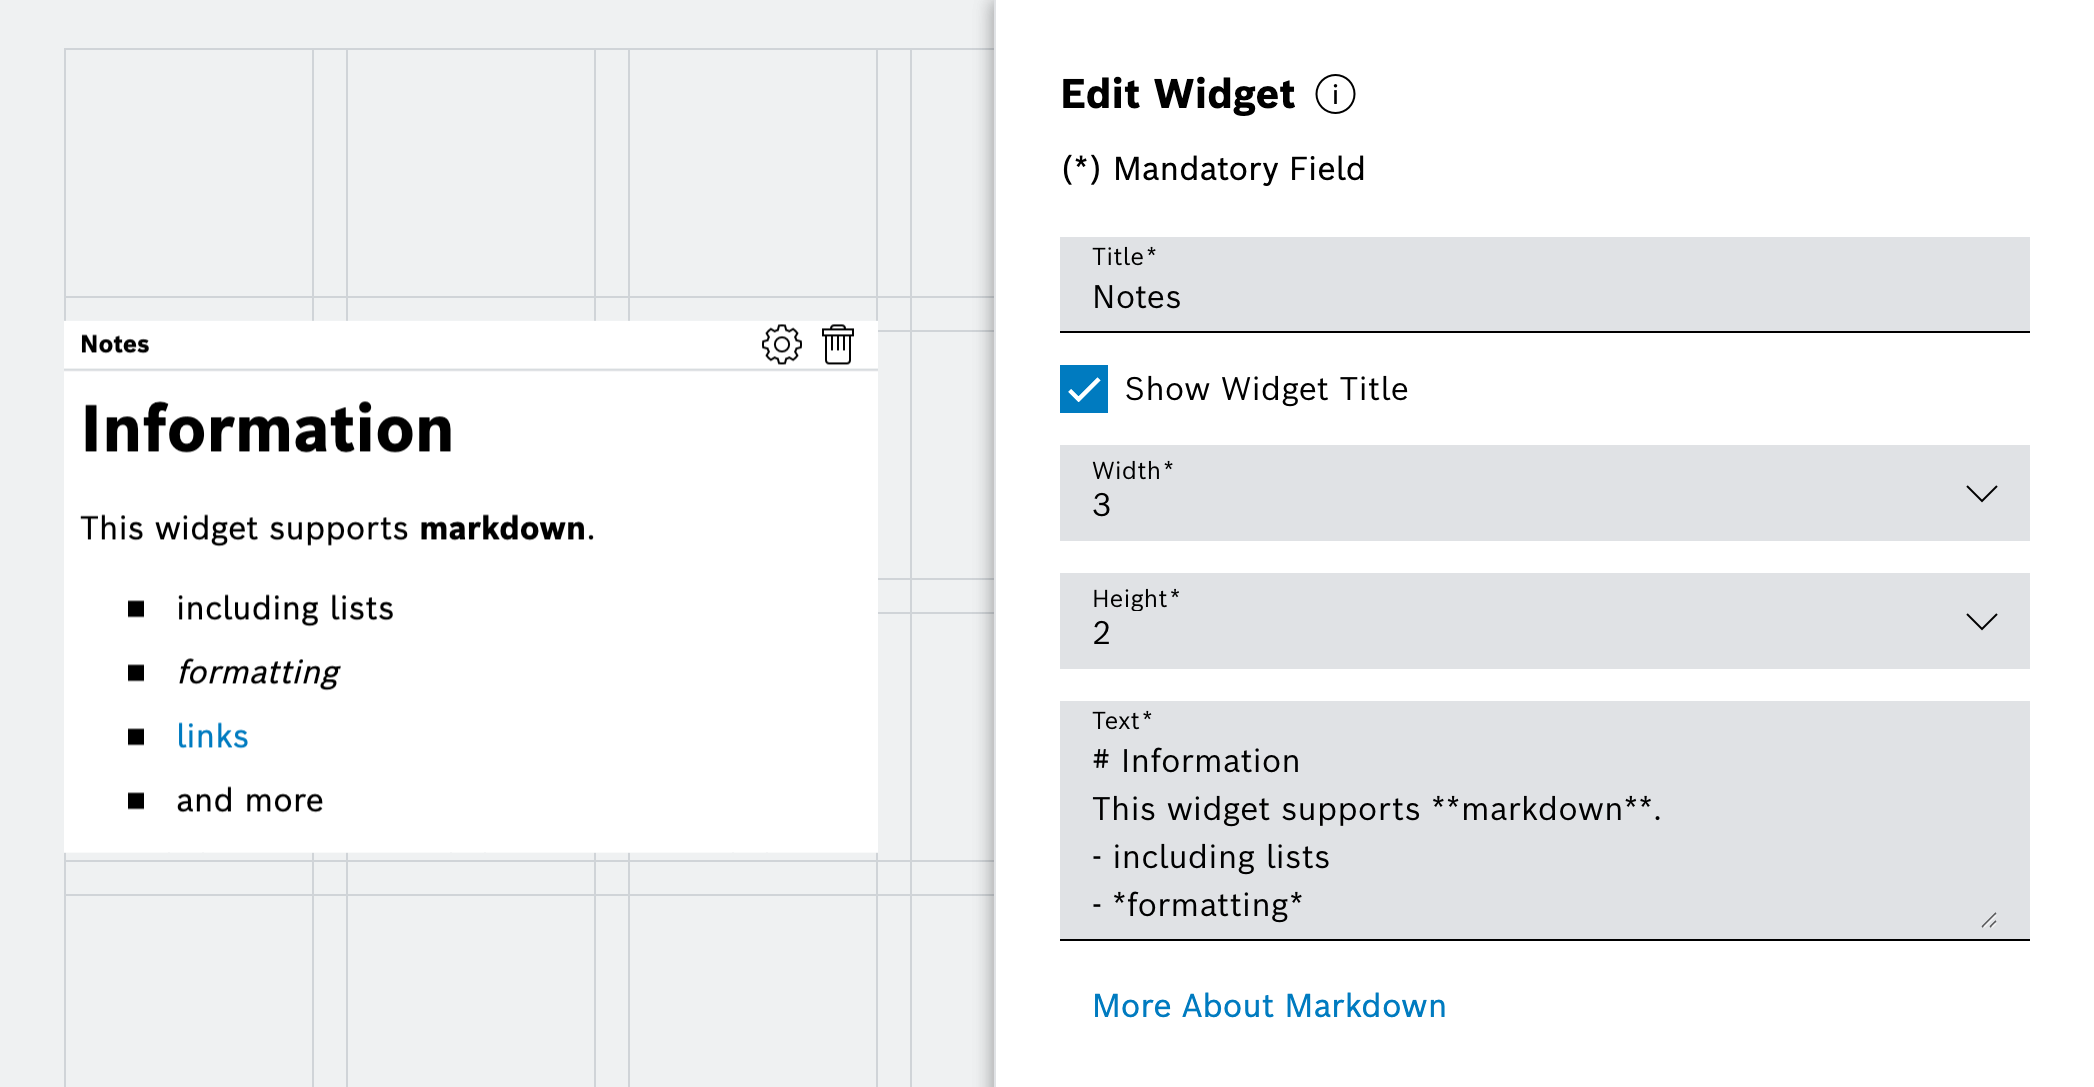
Notes widget: simple free-text widget for information. It supports markdown formatting as well as images.
-
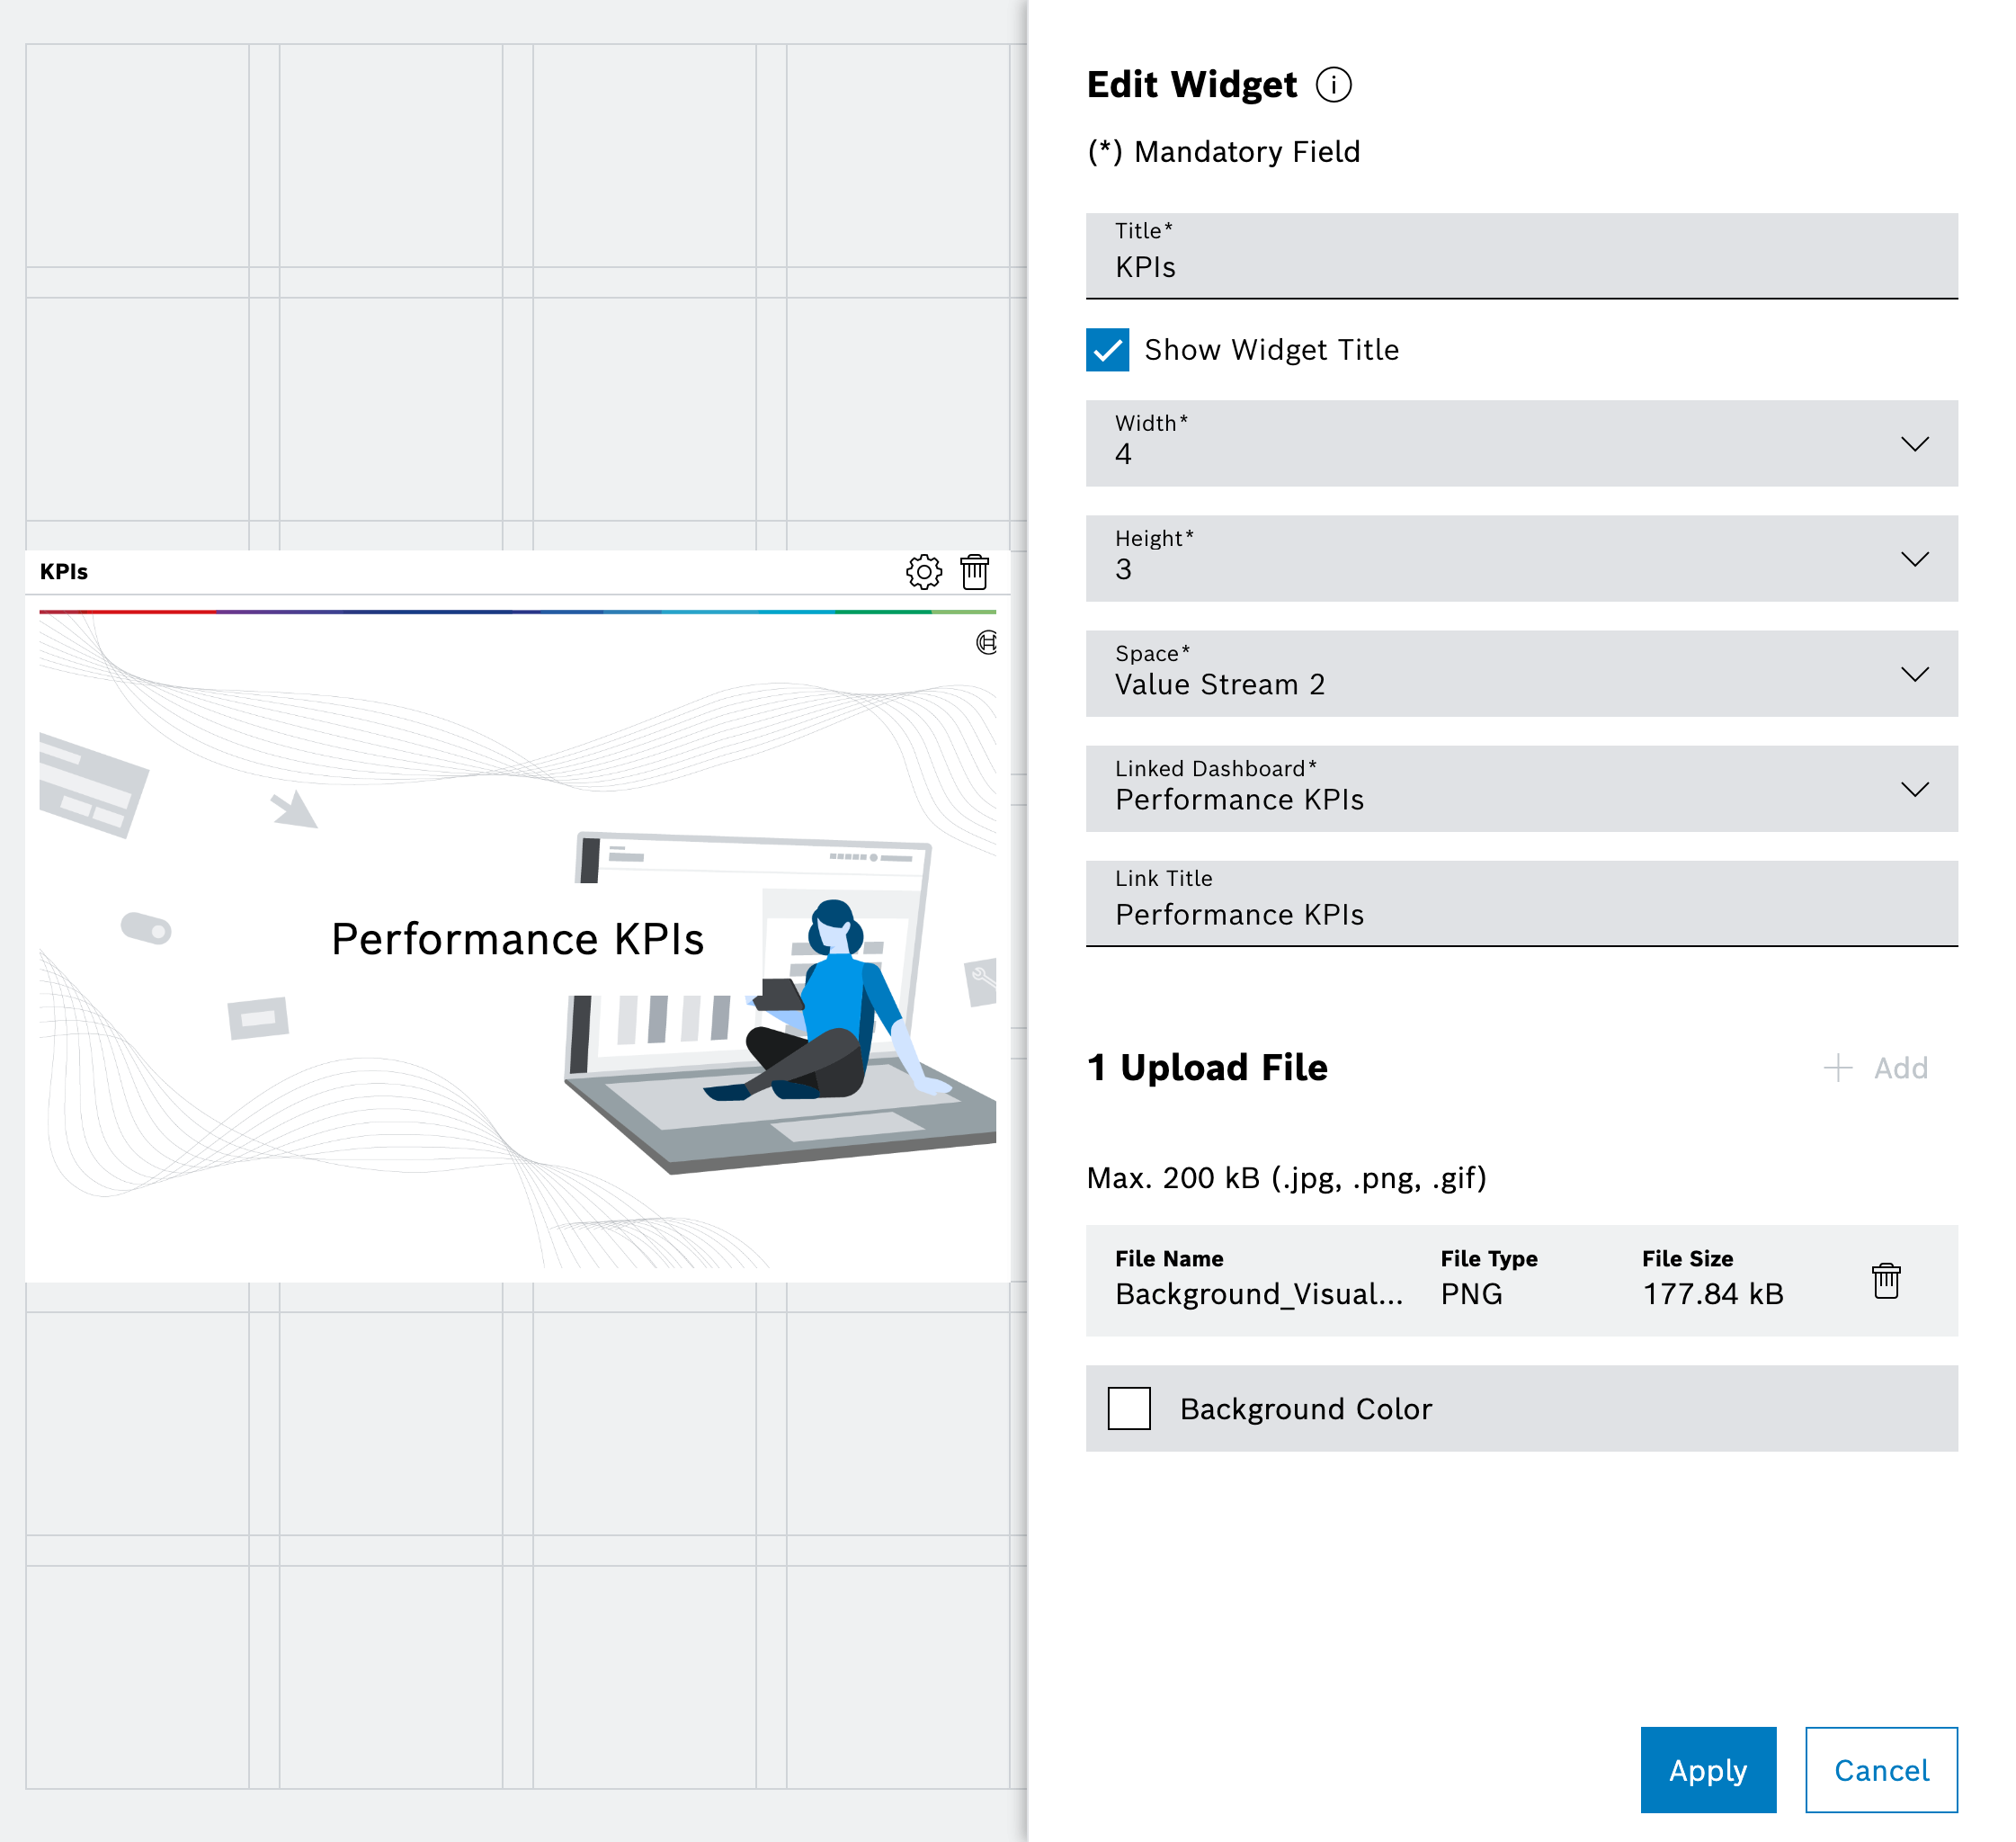
Dashboard Link widget: lets editors select a space and dashboard, choose a label, and optionally define a background color or image. Clicking the widget navigates directly to the target dashboard.
-
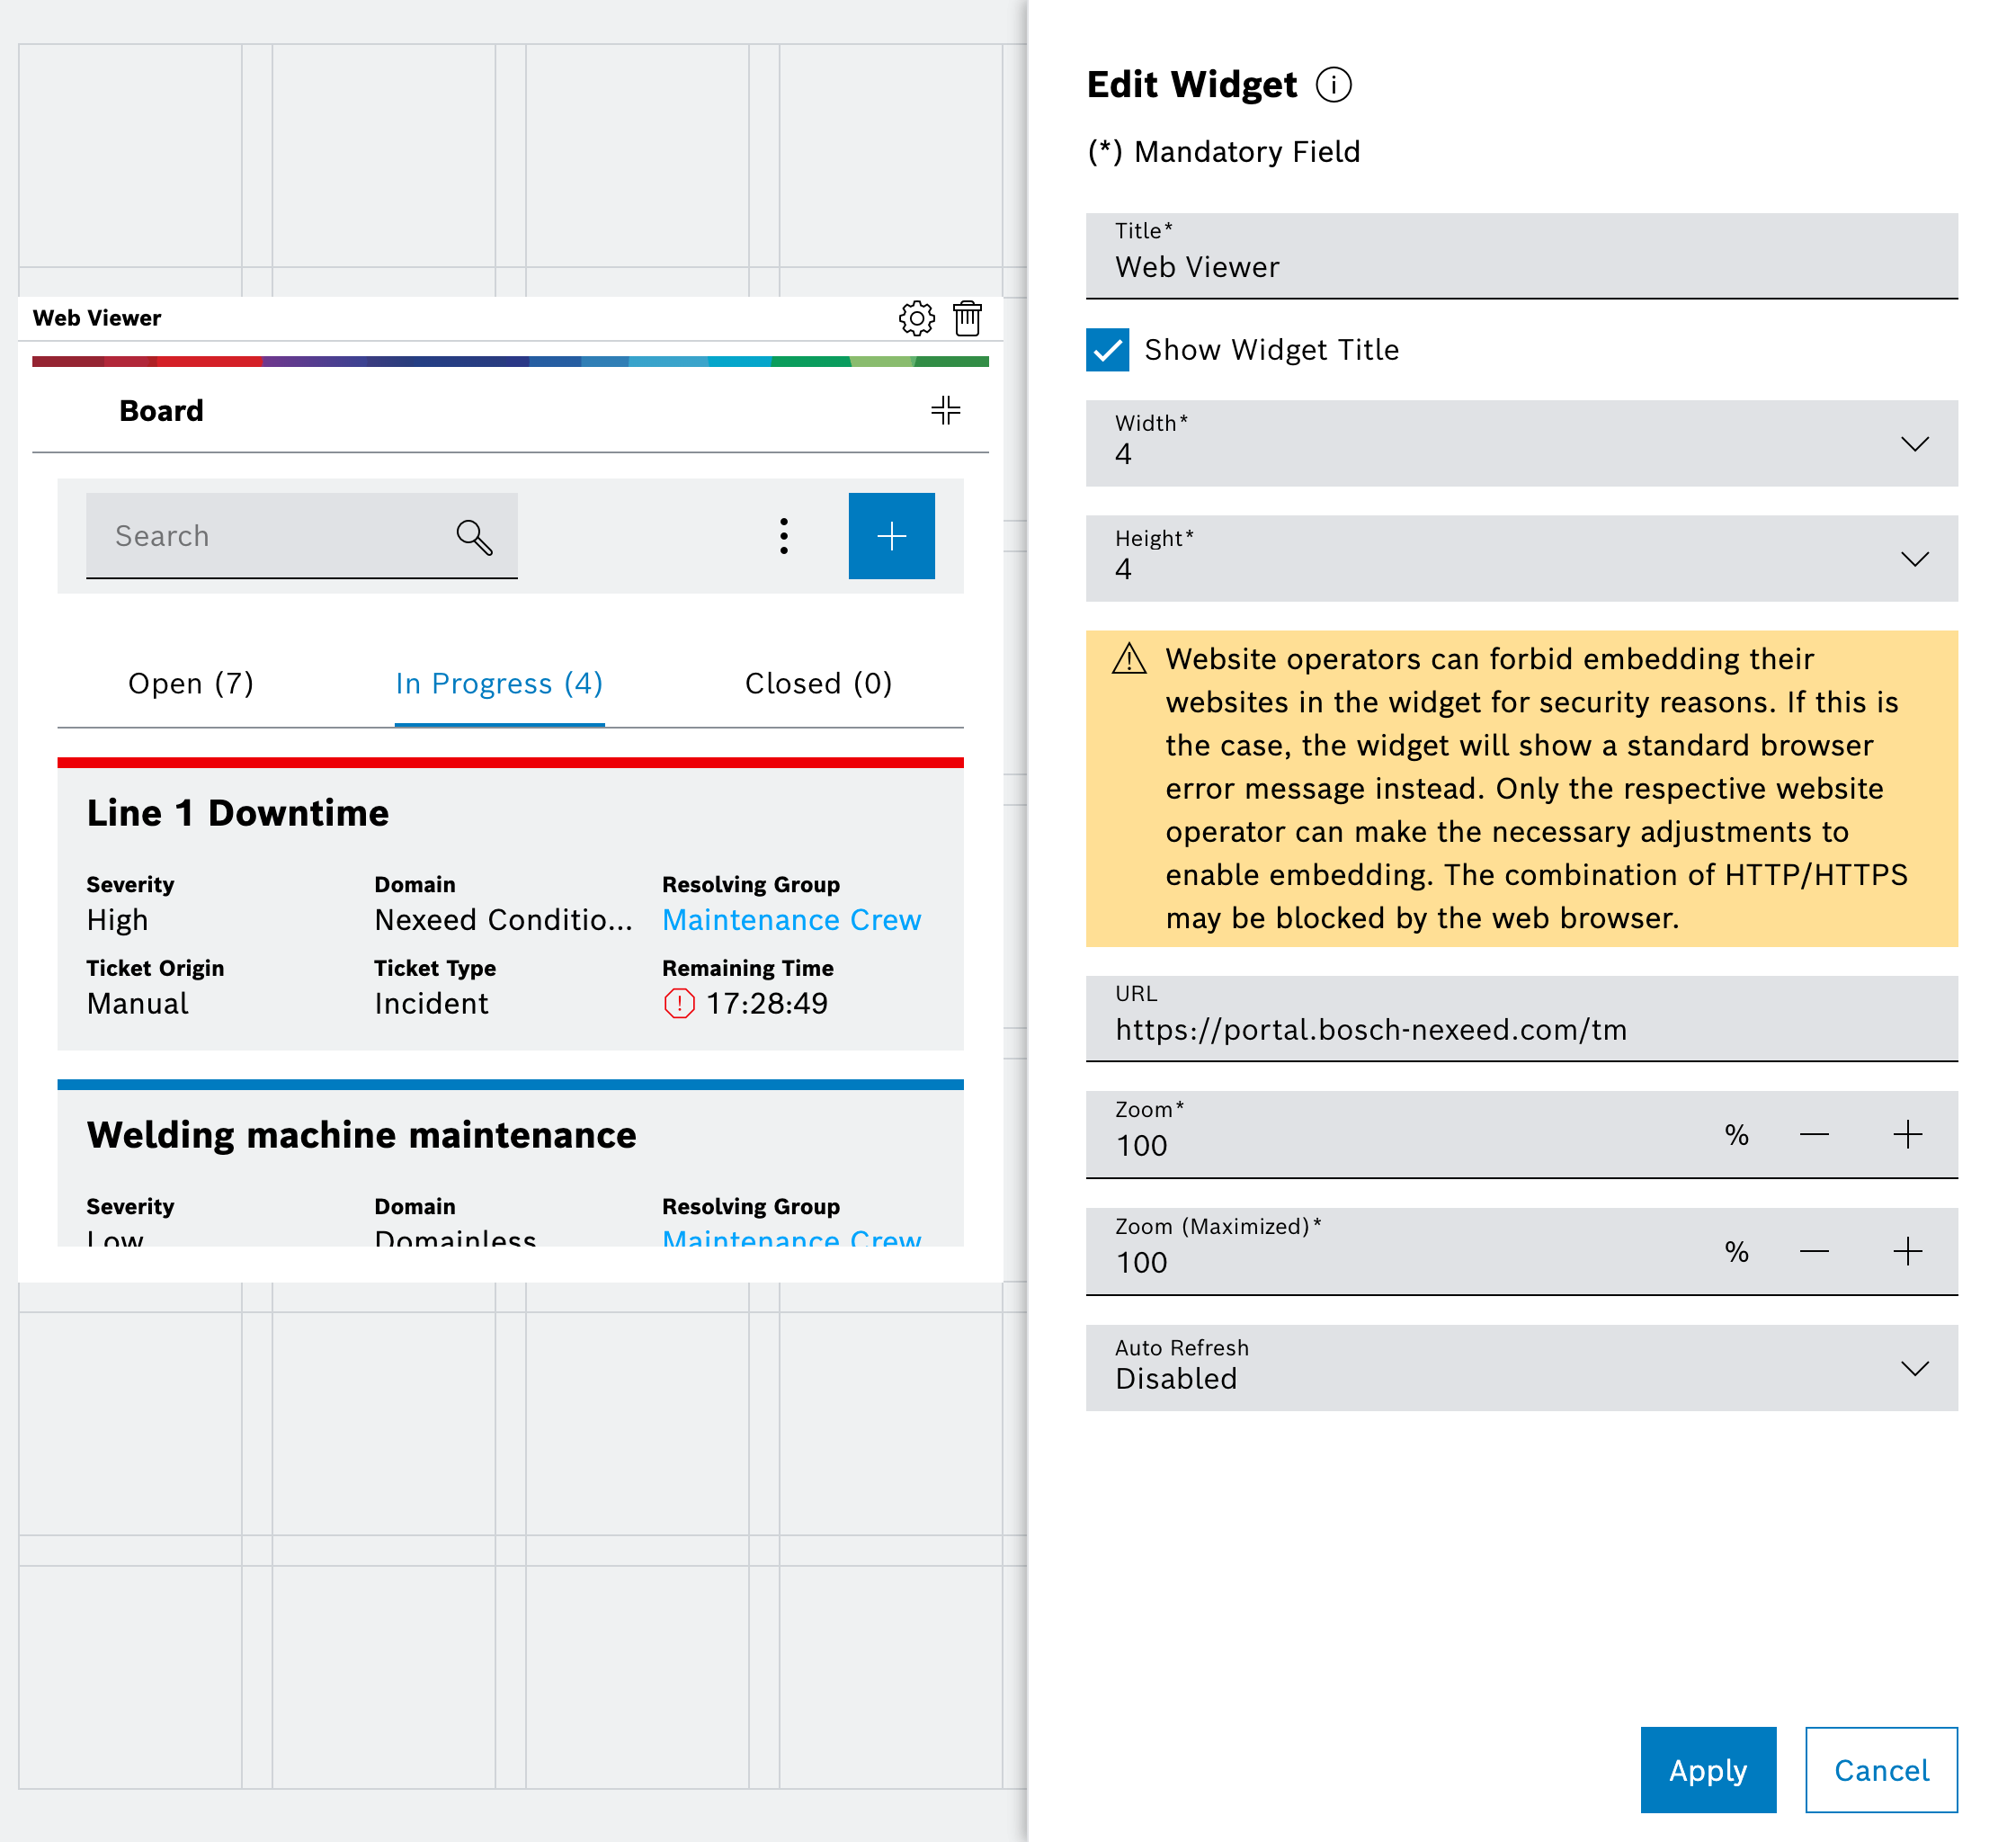
Web Viewer widget: embeds external or internal HTML pages via iframe. The target page must allow embedding through its Content-Security-Policy.