Events
When a device is selected in the Performance Analysis > Condition Monitoring menu, the Events tab is available. This tab shows all events created by rules or machines, helping users quickly find and understand potential problems. The AI feature "Event Sequence Detection" looks at connections between events to help spot issues early.
The following display options are available:
-
The List tab displays events in a list and trigger event sequence detections
-
The Grouped List tab Display events in a grouped list and count the number of occurrences of each event.
-
The Chart tab view the events in a chart, based on the timeline. It is possible to zoom in and out of the chart and navigate through time.
-
The Event sequences tab displays calculated event sequences of the AI Service.
List tab
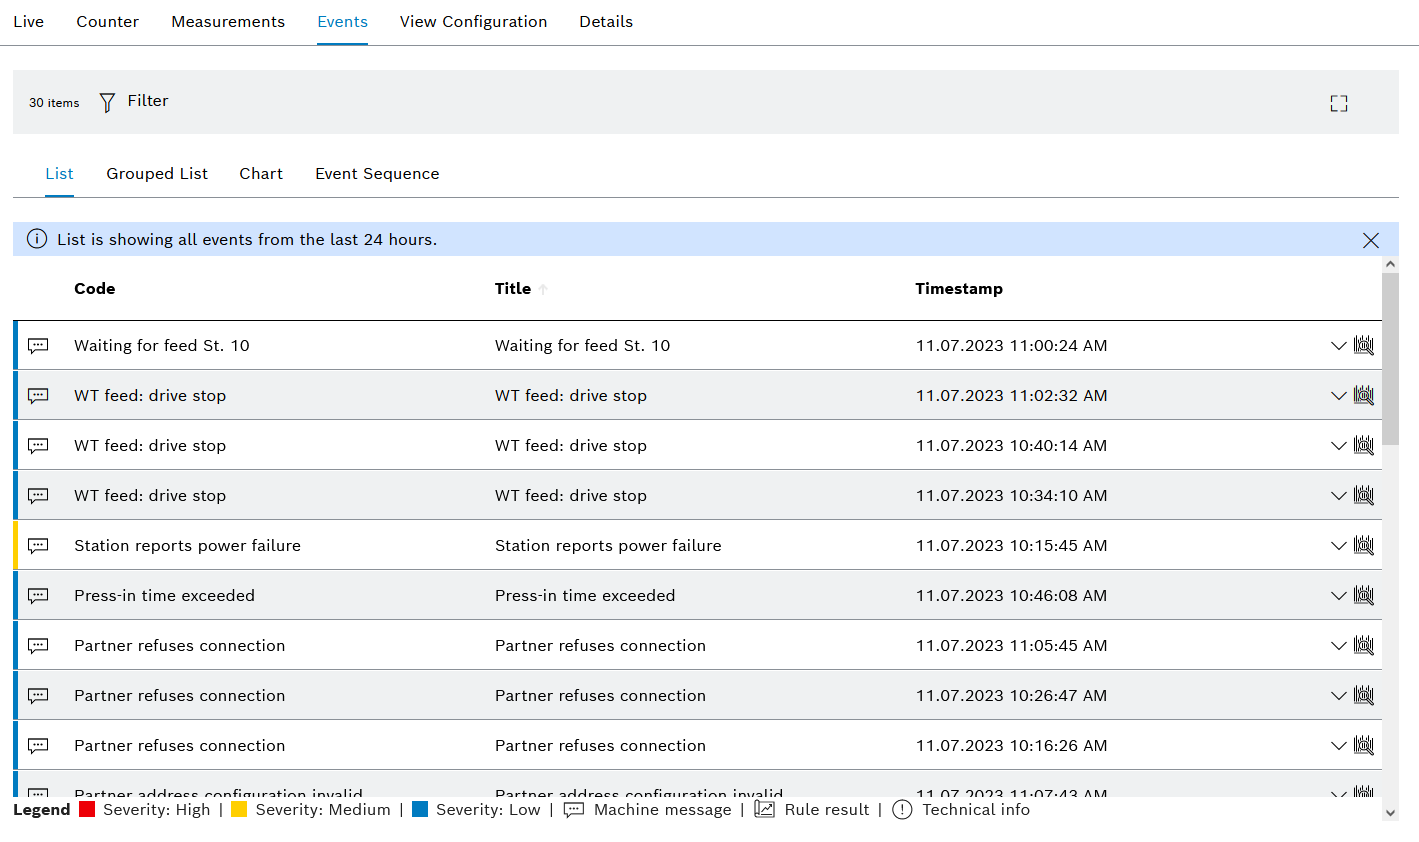
Machine messages, technical information and rule events of the device are displayed in a table in the detailed view under the Events tab in the List sub-tab. By default, the results of the last 24 hours are displayed. Here its also possible to trigger event sequence detection.
| Element | Description | ||
|---|---|---|---|
XX entries |
Number of events |
||
|
Filter the overview by selecting Time Range , Event Code , Severity and Title in the dialog window. |
||
|
Open full-screen mode. The full-screen mode can be closed with [ESC]. |
||
Code |
Code defined in the triggered rule or code of the machine message |
||
Title |
Description of the triggered rule or of the machine message |
||
Time |
Time at which the event occurred |
||
|
|
||
|
Expand or collapse all details of the event. |


Grouped list tab
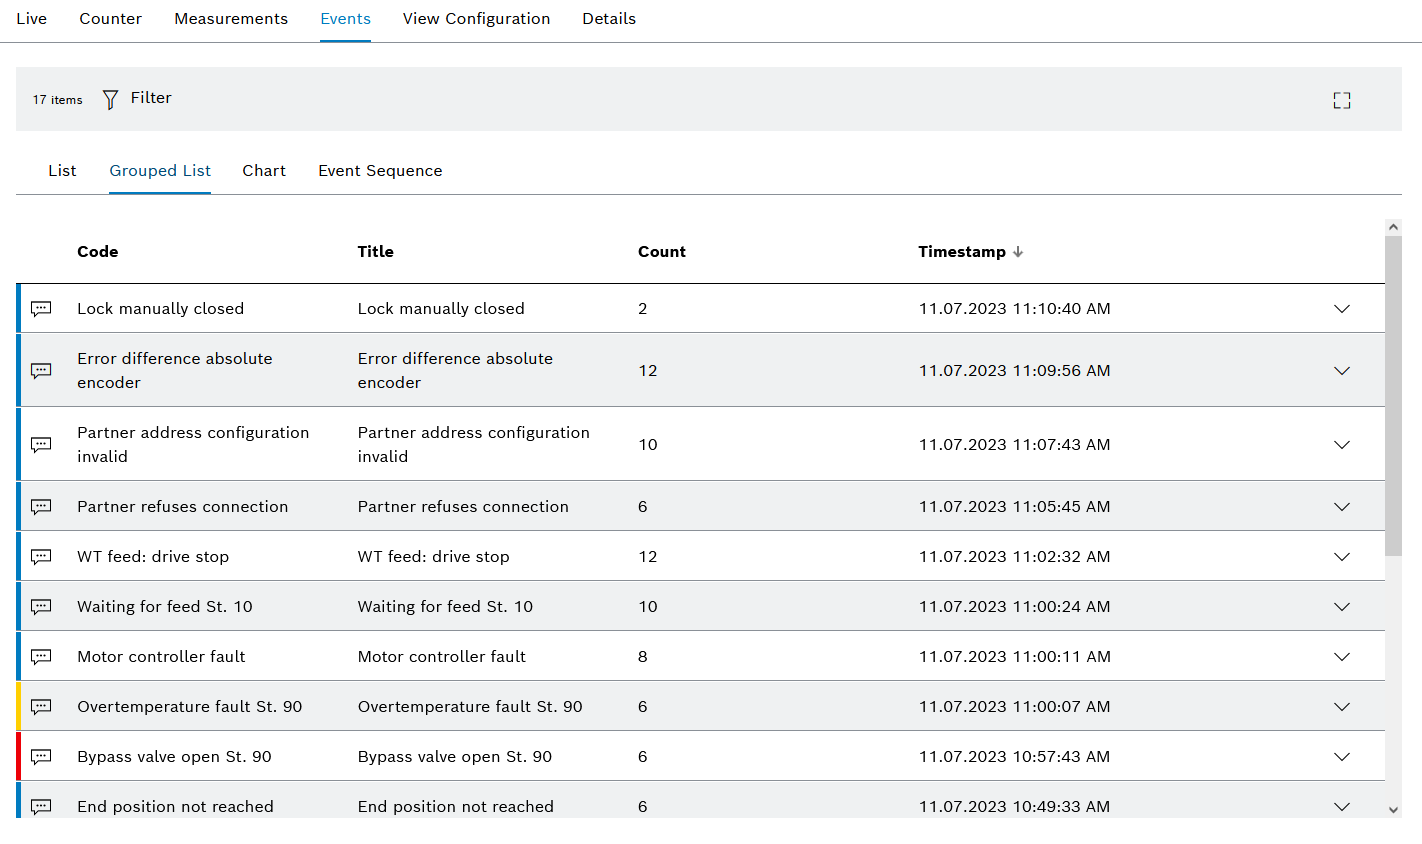
Machine messages, technical information and rule events of the device are displayed in a table grouped by priority, code, title and number of events in the detailed view under the Events tab in the Grouped List sub-tab.
| Element | Description |
|---|---|
XX entries |
Number of events |
|
Filter the overview by selecting Time Range , Event Code , Severity and Title in the dialog window. |
|
Open full-screen mode. The full-screen mode can be closed with [ESC]. |
Code |
Code defined in the triggered rule or code of the machine message |
Title |
Description of the triggered rule or of the machine message |
Count |
Number of times the event occurred |
Time |
Time when the event last occurred |
|
Expand and collapse all details of the event. |
Chart tab
Device events (machine messages, rule results, technical information) are displayed in a graphical view in the Chart tab under the Events tab in the detailed view.
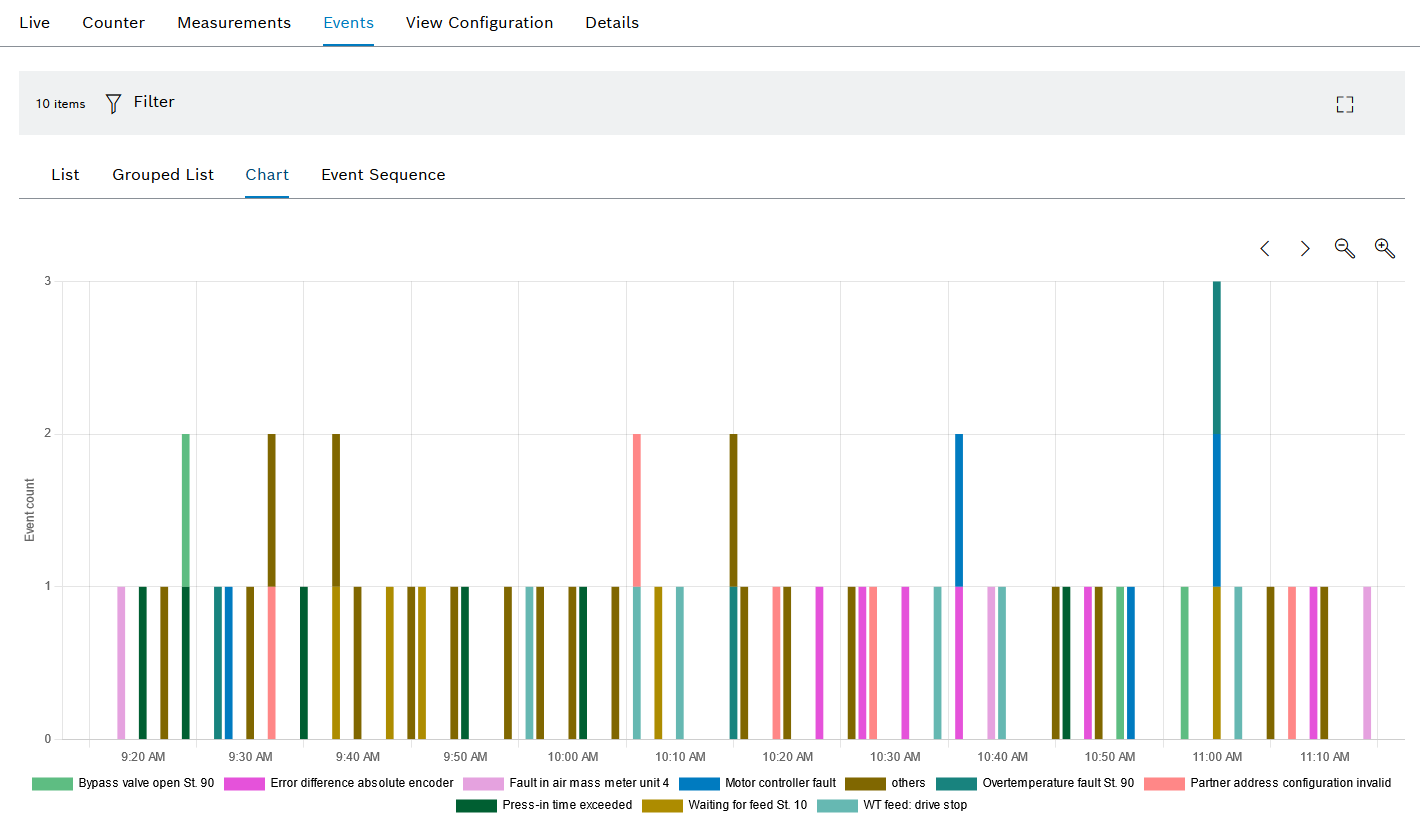
| Element | Description | ||
|---|---|---|---|
XX entries |
Number of events |
||
|
Filter the overview by selecting Time Range , Event Code , Severity and Title in the dialog window. |
||
|
Open full-screen mode. The full-screen mode can be closed with [ESC]. |
||
|
Navigate forward or back by half an hour. |
||
|
Zoom in and out.
|


Event sequences tab
|
If the Backend-Service AI Services module is installed, event sequence detection is available. |
Calculated event sequences of the AI Service are displayed in the Event Sequences tab under the Events tab in the detailed view.
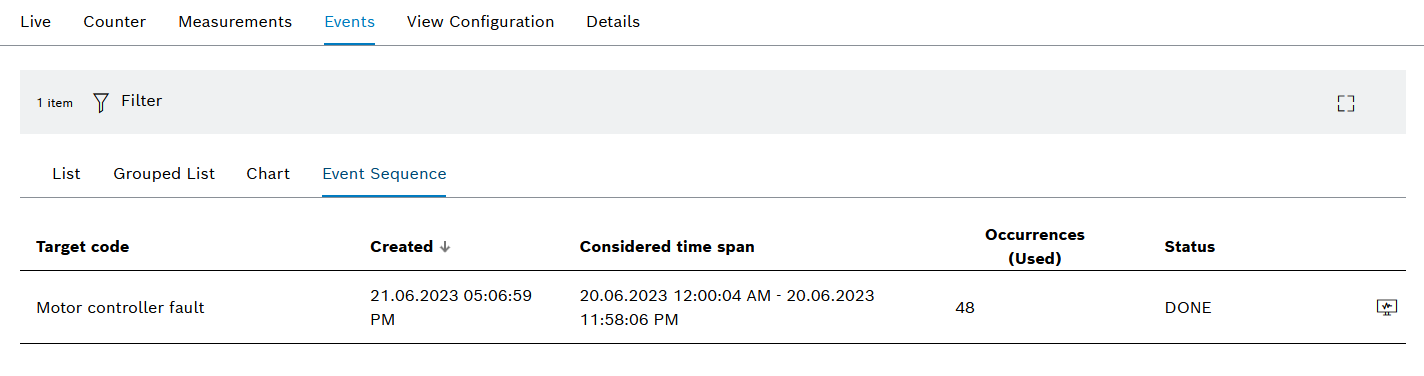
| Element | Description |
|---|---|
X item/XX items |
Number of event sequences |
|
Filter the overview by selecting Time Range , Event Code , Severity and Title in the dialog window. |
|
Open full-screen mode. The full-screen mode can be closed with [ESC]. |
Target event |
Error code defined in the triggered rule |
|
The icon is displayed if there is no event sequence. This could be for the following reasons:
|
Created by |
Time at which the event sequence was created |
Time period in consideration |
Period of time monitored by the event sequence |
Number of target events (in consideration) |
Specifies how many times an event sequence was triggered. |
Status |
Status of the event sequence: DONE The event sequence is complete. STARTED The event sequence is running and monitoring the set target event. NOT STARTED The event sequence has not yet started. |
|
Display event sequence detection details. |

Event Sequence details
|
If the Backend-Service AI Services module is installed, event sequence detection is available. |
If  is selected for a row in the Event Sequences tab, the details of the event sequence will open. In the details, event sequences can be identified based on their relevance.
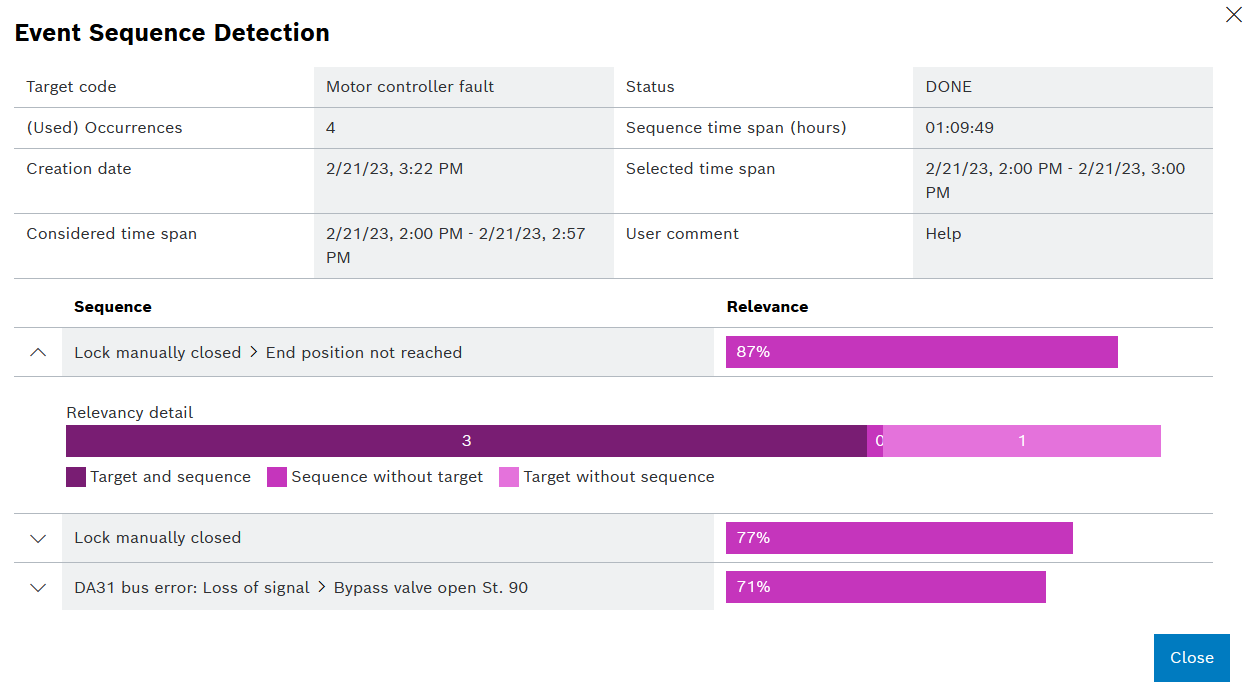
| Element | Description |
|---|---|
Target event |
Code of the rule or machine being examined. |
Number of target events (in consideration) |
Number of times the target event occurred |
Date of execution |
Time at which the event sequence detection was created |
Time period in consideration |
Period of time monitored by the event sequence detection |
Status |
Event sequence detection status: DONE Event sequence detection is complete. STARTED The event sequence is running and monitoring the set target event. NOT STARTED Event sequence detection has not yet been started. |
Sequence time period (hours) |
Time period in hours monitored by the event sequence detection |
Time period selected |
Period of time selected for the event sequence detection |
Comments |
Additional information on the event sequence detection |
Sequence |
Name of the rule triggered by the event sequence detection |
Relevance |
The relevance indicates how well event sequence detection leads to the target event. |
Trigger Event Sequence Detection
|
If the Backend-Service AI Services module is installed, event sequence detection is available. |
Prerequisites
-
Condition Monitoring UserorCondition Monitoring Administratorrole -
An event is triggered.
Procedure
-
Call up the Efficiency analysis > Condition monitoring menu.
-
Select device.
-
In the detailed view, call up the Results tab.
-
Open the List tab.
-
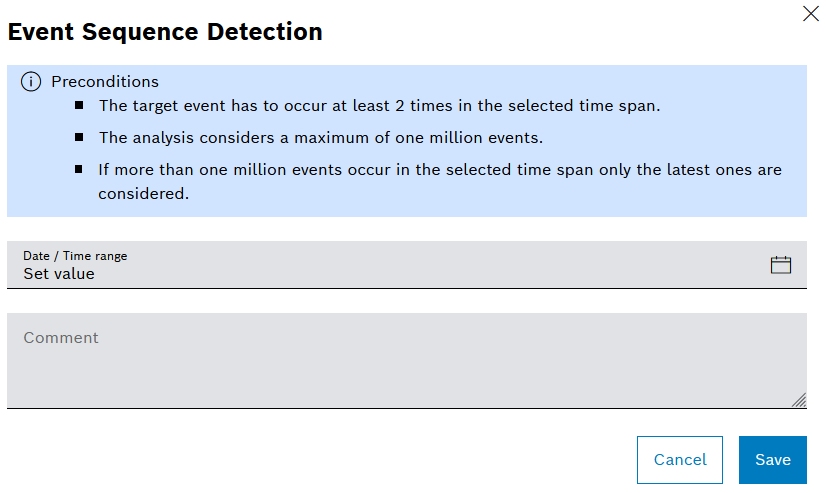
Open the event sequence in the event row with
 .
.
-
Select date/time period :
-
Select a time frame.
-
Select the time range from the drop-down list.
Or:
-
Select the time range.
-
Select the date or date range using the calendar.
-
Select the time using the Start time and End time fields.
-
-
Enter a Comment.
-
Trigger the event sequence with Save.
Event sequence detection is triggered and displayed in the Events Tab — Event sequences.
Event Sequence Detection details
|
If the Backend-Service AI Services module is installed, event sequence detection is available. |
When using event sequence detection to find a specific event target, the event sequence detection analyzes event data, such as rule results and machine messages. Event sequence detection can be used to detect anomalies before an event target is reached.
A rule can be created for event sequence detection. A rule is triggered as soon as the specified sequence occurs. In this way, certain behaviors can be identified so that they can be responded to as quickly as possible.
The event sequence detection calculates the following variables:
-
Confidence
Confidence indicates how often the event target occurs after the sequence.
-
support
Support indicates how often the sequence occurs before the event target.
-
Relevance
Relevance is the geometric mean value of Confidence and Support.
Prerequisites
-
Production plannerorAdministratorrole -
The Backend-Service AI Services module has been installed.
-
At least two event targets have occurred during the specified time period.
Example calculations
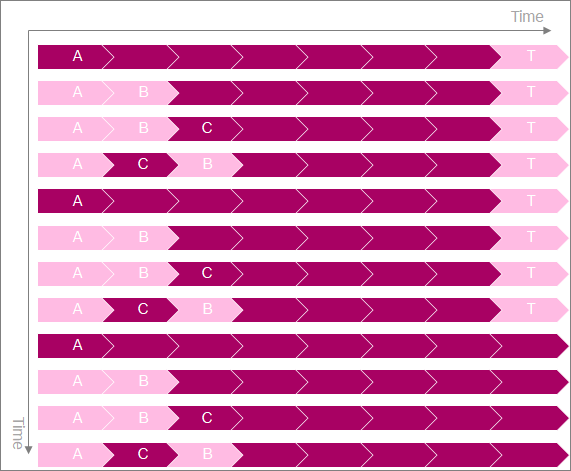
| Performance size | Description | Calculation |
|---|---|---|
Confidence |
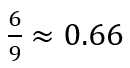
In 6 (= dark red A or C) out of 9 (= dark red A or C) cases, the event target (= T) occurs after the sequence. Values in the event sequence details: Target event and sequence/number of (viewed) target events = confidence value |
|
support |
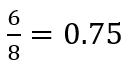
In 6 (= dark red A or C) out of 8 (= T) cases, the sequence occurs before the event target (= T). Values in the event sequence details: Target event and sequence/(target event and sequence + sequence without target event) = support value |
|
Relevance |
The relevance indicates how well event sequence detection leads to the target event. Values in the event sequence details: √ (confidence value + support value) = relevance value |
|